



INDICATOR · BEGINNER GUIDE
BOLLINGER BANDS
A 20-candle average with a band either side. The bands widen when price gets wild and squeeze when it goes quiet.
◆Middle line = SMA 20◆Bands 2 deviations away◆Three grey lines◆Alerts on closes outside
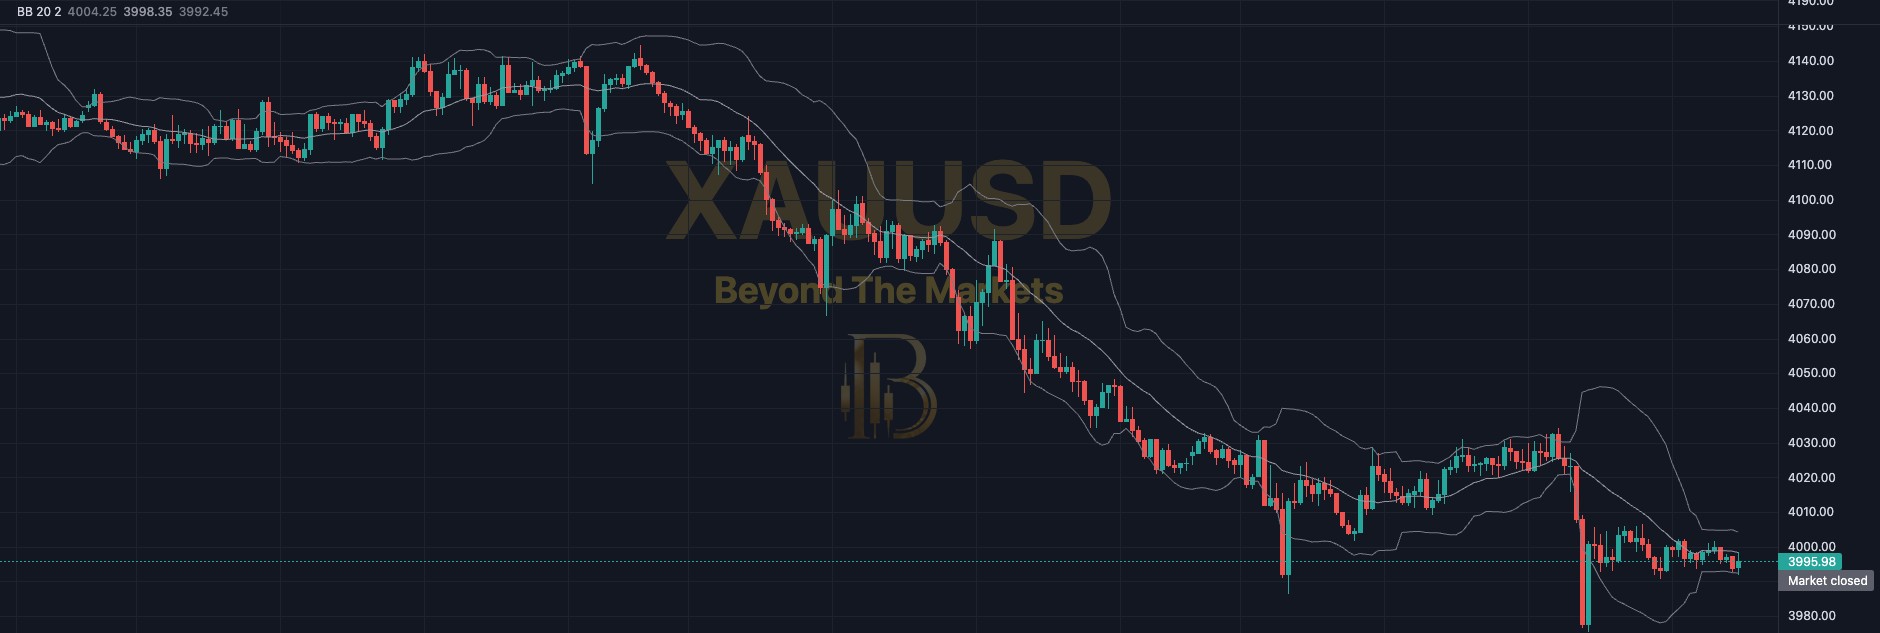 WHAT YOU SEE · GOLD 15m · BB 20 2
123456
1Middle line (basis): the average close of the last 20 candles, an SMA 20.
2Upper band: 2 standard deviations (how spread out prices are) above the middle line.
3Lower band: 2 standard deviations below the middle line.
4Squeeze: the bands pinch close together. The market is quiet; a bigger move can follow.
5Expansion: the bands spread wide apart. A strong move is under way.
6Riding the band: in a strong trend, candles can keep closing at or outside one band.
Use it in 5 steps
- Switch it onOpen Charts → Basic Indicators (ƒx) → tick Bollinger Bands. Three grey lines appear around price; the legend reads BB 20 2.
- Spot the squeezeWhen the bands pinch tight, get ready. Do not guess the direction: wait for a candle to close outside a band.
- A touch is not a reversalTouching the upper band is not an automatic sell. In a strong uptrend price can ride that band for many candles.
- Use the middle lineIn a trend, pullbacks to the middle line can offer entries in the trend’s direction. In a sideways market it is the centre of the range.
- Stop past the swingPut your stop loss beyond the recent swing high or low. When the bands are wide, the stop must be wider and the trade smaller.
Squeeze, then break
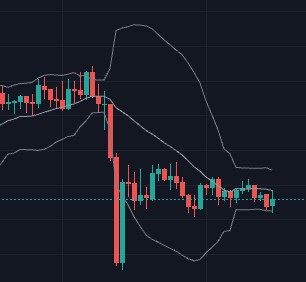
Gold 15m, 23 Oct. The bands squeezed tight around small candles, then one big candle closed far below the lower band and the bands opened out sharply.
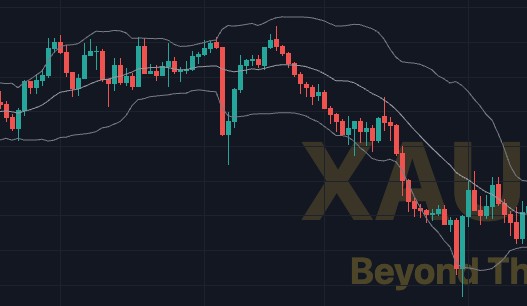
Range or trend?
- Flat middle line, price bouncing band to band: a range. The bands act like soft edges.
- Sloping middle line, price hugging one band: a trend. Trading against it is risky.
- Wide bands = big candles. You need a wider stop and a smaller position.
- Settings: Length 20 and StdDev 2. A bigger StdDev pushes the bands further out.
- Alerts need a candle to close outside a band. A quick wick does not count.
Golden rules
- Outside the band is not a reversal. Strong trends close outside it again and again.
- A squeeze has no direction. Wait for the break and a closed candle.
- Never skip the stop loss. Risk 1% of your account or less per trade.
- Practise first with the Replay button: trade old candles for free.
🔔 Get told when it fires: click Alerts, choose Bollinger Bands and tick “Price closes above the upper band”.
For educational purposes only. The results in this guide come from testing on past prices. Past performance does not guarantee future results, and real spreads, slippage and delays can make results worse. Nothing here is financial advice, and trading carries a high risk of losing money. Read the risk warning.