



INDICATOR · BEGINNER GUIDE
ELLIOTT WAVE
Counts Elliott waves for you: five-wave trend moves labelled 1 to 5, the A-B-C pullback after them, and where it may end.
◆Automatic 1-5 wave counts◆Two wave sizes shown◆A-B-C corrections marked◆Fibonacci pullback levels
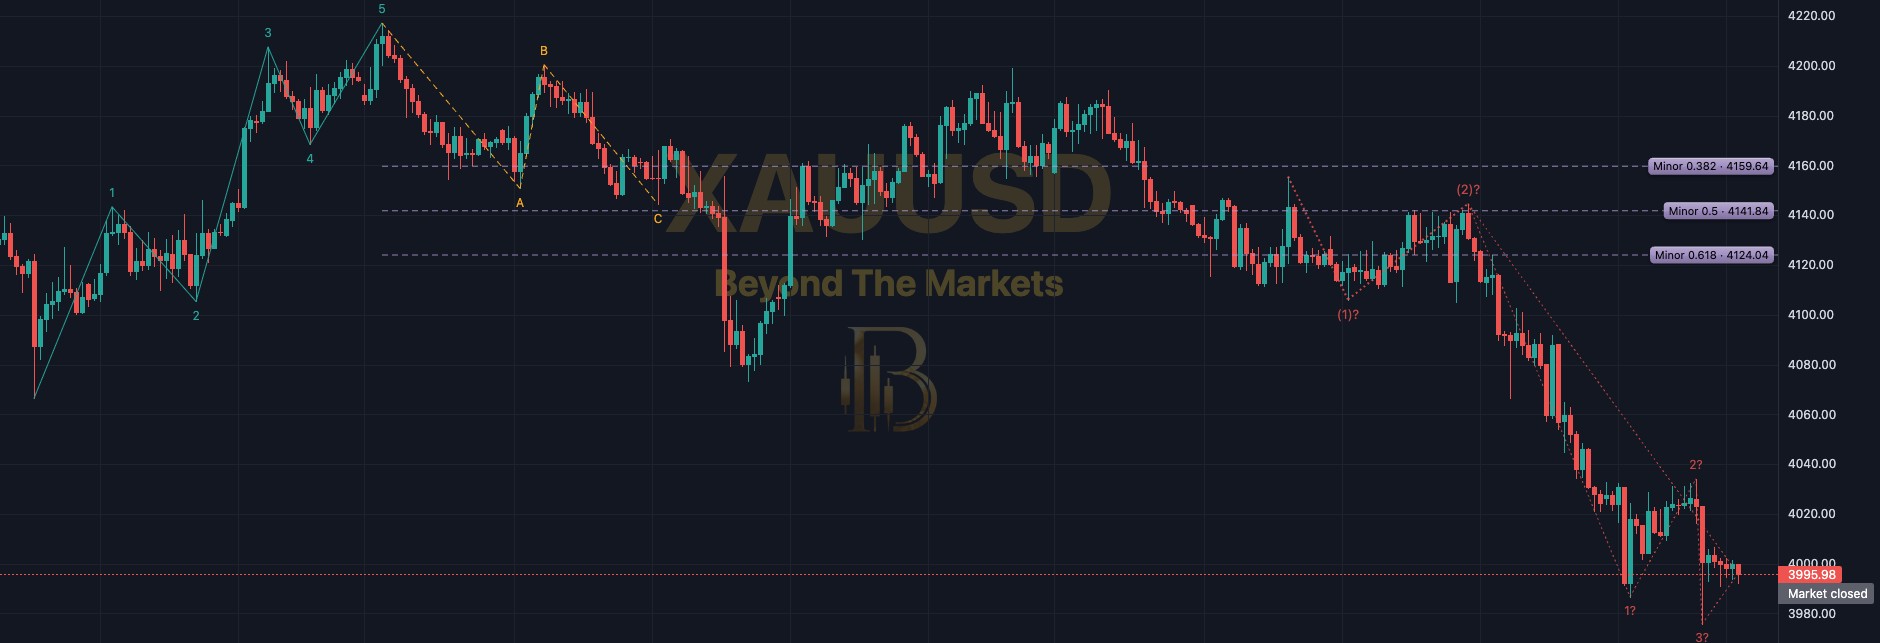 WHAT YOU SEE · GOLD 1H
13456
1Green waves 1-5: a finished bullish impulse: five swings that pass the Elliott rules, moving up.
2Red waves 1-5: the same thing moving down: a bearish impulse.
3Orange A-B-C: the correction (pullback) after an impulse. C goes beyond A.
4Bracketed numbers: (1) to (5) and (A)-(C) are a bigger wave size. Small waves sit inside them.
5Dotted lines with “?”: a count still forming. It can change or vanish with the next swing.
6Purple Fibonacci lines: 0.382, 0.5 and 0.618 of the last impulse: where a correction may end.
Use it in 5 steps
- Switch it onOpen Charts → Basic Indicators → tick Elliott Wave. It counts two wave sizes for you: 1-5 and (1)-(5).
- Find the last finished countLook for a full green (up) or red (down) 1-2-3-4-5. After five waves, a correction may follow.
- Watch the purple levelsAfter an impulse, the 0.382, 0.5 and 0.618 lines show where a pullback may end. Wait for price to react there.
- Treat “?” counts with careDotted labels with a ? are still forming. Do not trade them as if they were finished.
- Watch the wave 4 levelIf price breaks the wave 4 low (or high) after a finished impulse, the impulse looks finished and the trend may have turned.
Reading a count
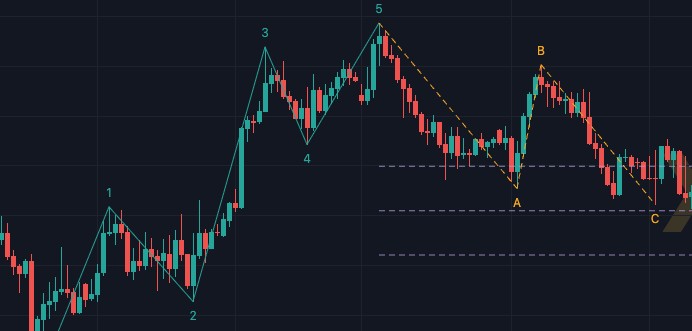
Gold 1H, 7–14 Oct. A green 1-2-3-4-5 count up, then an orange A-B-C pull-back. The purple lines mark 0.382, 0.5 and 0.618 of the move.
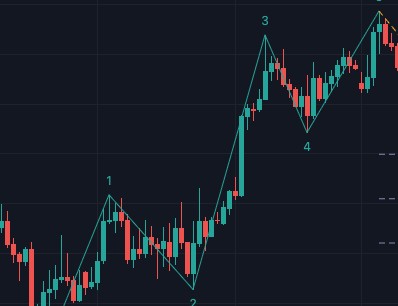
The wave rules
- Wave 2 never goes back beyond the start of wave 1.
- Wave 3 goes beyond the end of wave 1 and is never the shortest of waves 1, 3 and 5.
- Wave 4 does not overlap wave 1’s price area. Wave 5 goes beyond the end of wave 3.
- A-B-C: B stays inside the impulse and C goes beyond A.
- Swings must be confirmed first: 5 candles each side for 1-5, 13 for (1)-(5). So counts appear late.
Golden rules
- A count is one reading, not a forecast. Other traders may count the same chart differently.
- Never skip the stop loss. Risk 1% of your account or less per trade.
- Counts can change as new swings form, especially the newest ones. Never trade a “?” label alone.
- Practise first with the Replay button: play old candles forward and watch counts form.
🔔 Get told when it happens: click Alerts (the bell), choose Elliott Wave and tick “A 5-wave impulse completes” and “An A-B-C correction completes”.
For educational purposes only. The results in this guide come from testing on past prices. Past performance does not guarantee future results, and real spreads, slippage and delays can make results worse. Nothing here is financial advice, and trading carries a high risk of losing money. Read the risk warning.