



INDICATOR · BEGINNER GUIDE
MACD
Two lines and a histogram in their own pane, showing trend direction and momentum (speed). Watch the blue and orange lines cross.
◆Settings 12, 26 and 9◆Blue MACD, orange signal◆Bars = gap between lines◆Zero line = trend side
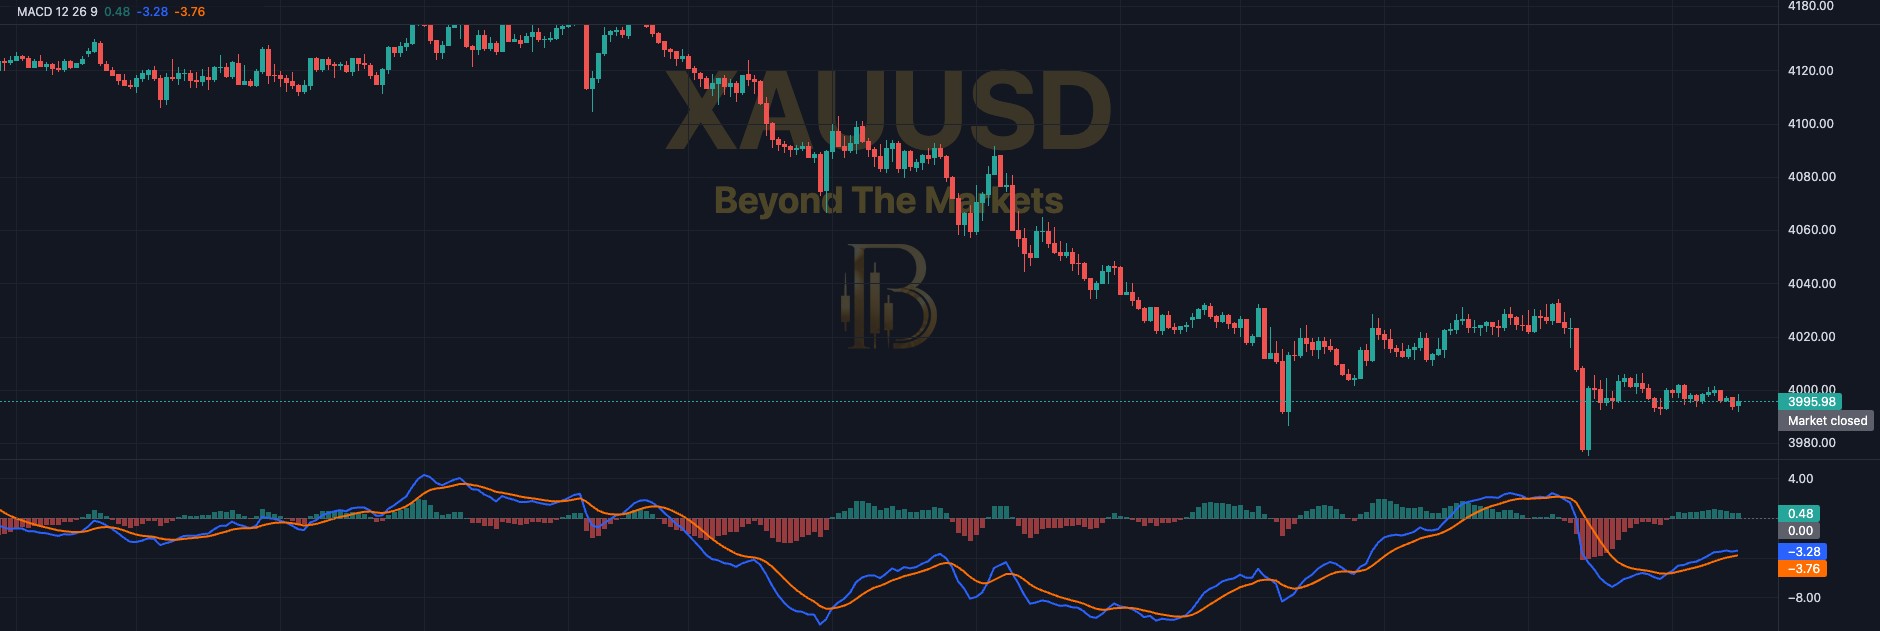 WHAT YOU SEE · GOLD 15m · PRICE + MACD PANE
123456
1Blue line (MACD): the gap between a fast (12) and a slow (26) average of price. Above zero = fast is above slow.
2Orange line (signal): a 9-candle average of the blue line. It trails just behind it.
3Green bars: blue is above orange: upward momentum. Taller bars = the gap is growing.
4Red bars: blue is below orange: downward momentum.
5Zero line: lines above it = the up side of the trend. Below it = the down side.
6A cross: blue crosses above orange (bars turn green) or below it (bars turn red).
Use it in 5 steps
- Switch it onOpen Charts → Basic Indicators (ƒx) → tick MACD. It opens in its own pane, labelled MACD 12 26 9.
- Check the zero lineLines above zero: the trend side is up, favour buys. Below zero: favour sells.
- Watch for the crossBlue crossing above orange = momentum turning up. Crossing below = turning down. Wait for the candle to close.
- Cross with the trendA buy cross above zero agrees with the trend. One far below zero goes against the bigger trend, so take extra care.
- Watch the bars shrinkBars getting shorter mean the move is losing speed. Treat it as an early warning, not an exit signal on its own.
Reading a cross
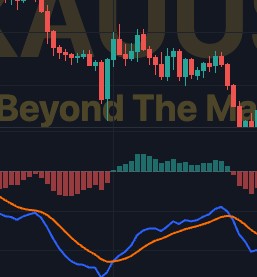
Gold 15m, 22 Oct. After a steep fall the blue line crossed back above the orange one and the histogram flipped from red to green on the same candle.
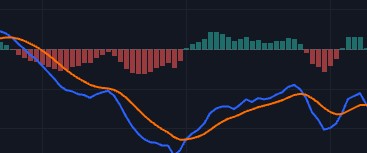
The histogram up close
- Each bar = the blue line minus the orange line on that candle.
- Green bars above zero: blue is above orange. Red bars below zero: blue is under orange.
- Growing bars: momentum building. Shrinking bars: momentum fading.
- The bars flip colour on the exact candle where the two lines cross.
- 12, 26 and 9 are the default lengths. Change them with ⚙ next to MACD.
Golden rules
- It lags. MACD is built from averages, so a cross comes after price has already turned.
- Sideways market? Crosses near zero come thick and fast. Skip them.
- Never skip the stop loss. Risk 1% of your account or less per trade.
- Practise first with the Replay button: play old candles forward and trade them for free.
🔔 Get told when it fires: click Alerts, choose MACD and tick “MACD crosses above the signal line” or “MACD crosses below the signal line”.
For educational purposes only. The results in this guide come from testing on past prices. Past performance does not guarantee future results, and real spreads, slippage and delays can make results worse. Nothing here is financial advice, and trading carries a high risk of losing money. Read the risk warning.