



INDICATOR · BEGINNER GUIDE
MOMENTUM SQUEEZE
Shows when the market is coiling up quietly, then marks the moment it releases with momentum one way.
◆Own pane under the chart◆Squeeze must last 6 bars◆200 EMA trend filter◆Daily squeeze shown too
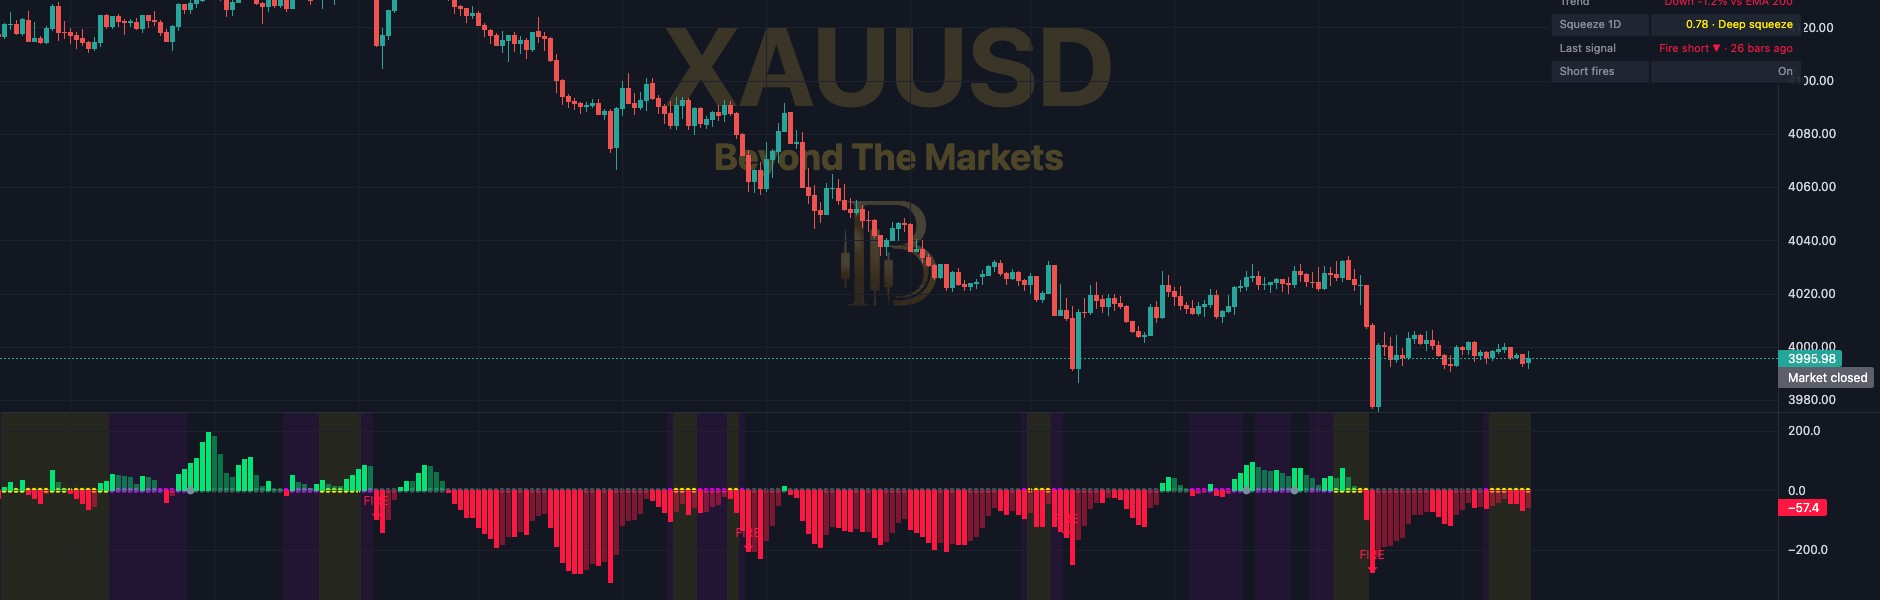 WHAT YOU SEE · GOLD 15m · PRICE + SQUEEZE PANE
123456
1Momentum columns: bright green = up and building, pale green = up but easing. Bright red / pale red = the same downwards.
2Purple dots: the squeeze is on. Price is moving in a narrower range than usual: energy is building.
3Yellow dots: a deep squeeze. The market is coiling hard.
4Shaded background: marks every squeeze period, so you can see how long it lasted.
5FIRE arrows: the squeeze released with momentum. Green up = long, red down = short.
6Panel: the squeeze state, momentum, trend and the daily chart’s squeeze, in words.
Use it in 5 steps
- Switch it onOpen Charts → Basic Indicators → tick Momentum Squeeze. It opens in its own pane under the price chart.
- Spot the squeezePurple dots (yellow = deep) mean price is coiling. A squeeze shows energy building, not which way it will go.
- Wait for the releaseWhen the dots turn grey, the squeeze is over. It only counts if it lasted at least 6 bars.
- Read the FIRE arrowGreen FIRE: rising momentum above zero and price above the 200 EMA. Red FIRE is the mirror. A grey dot means no clear direction.
- Plan it on the price chartFind your entry and stop on the candles, for example a stop beyond the quiet range the squeeze made. Then size the trade.
Reading a fire
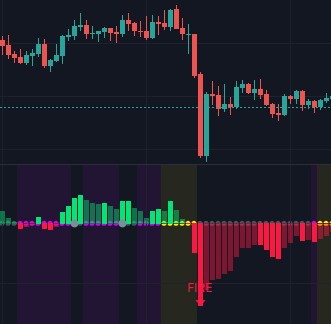
Gold 15m, 23 Oct. A quiet spell (shaded squeeze), then the release: a red FIRE arrow as momentum dropped hard, with the big red candle above.
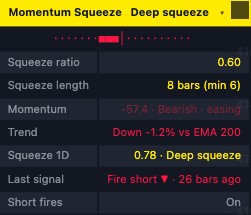
The panel
- Title bar: purple = squeeze on, yellow = deep squeeze. Once released it turns green or red with momentum.
- Meter: ■ blocks to the right (green) or left (red) of the │ show how strong momentum is.
- Squeeze ratio: under 1.00 = squeeze on, under 0.80 = deep. Squeeze length counts the bars (min 6).
- Momentum: Bullish or Bearish, building or easing. Trend: Up or Down, and how far from the 200 EMA.
- Squeeze 1D: the daily chart’s squeeze, from the last finished day. Last signal shows the last FIRE.
Golden rules
- A squeeze is not a signal. Wait for the release and a FIRE arrow on a closed candle.
- Never skip the stop loss. Risk 1% of your account or less per trade.
- Grey dot on release? No clear direction, so stay out and wait for the next squeeze.
- Practise first with the Replay button: play old candles forward and trade them for free.
🔔 Get told when it happens: click Alerts (the bell), choose Momentum Squeeze and tick “Fire long” and “Fire short”.
For educational purposes only. The results in this guide come from testing on past prices. Past performance does not guarantee future results, and real spreads, slippage and delays can make results worse. Nothing here is financial advice, and trading carries a high risk of losing money. Read the risk warning.