



INDICATOR · BEGINNER GUIDE
SMA MOVING AVERAGE
One orange line: the average close of the last 20 candles. It smooths out noise so the trend is easy to see.
◆Average of last 20 closes◆Every candle counts equally◆One orange line on price◆Alerts when price crosses
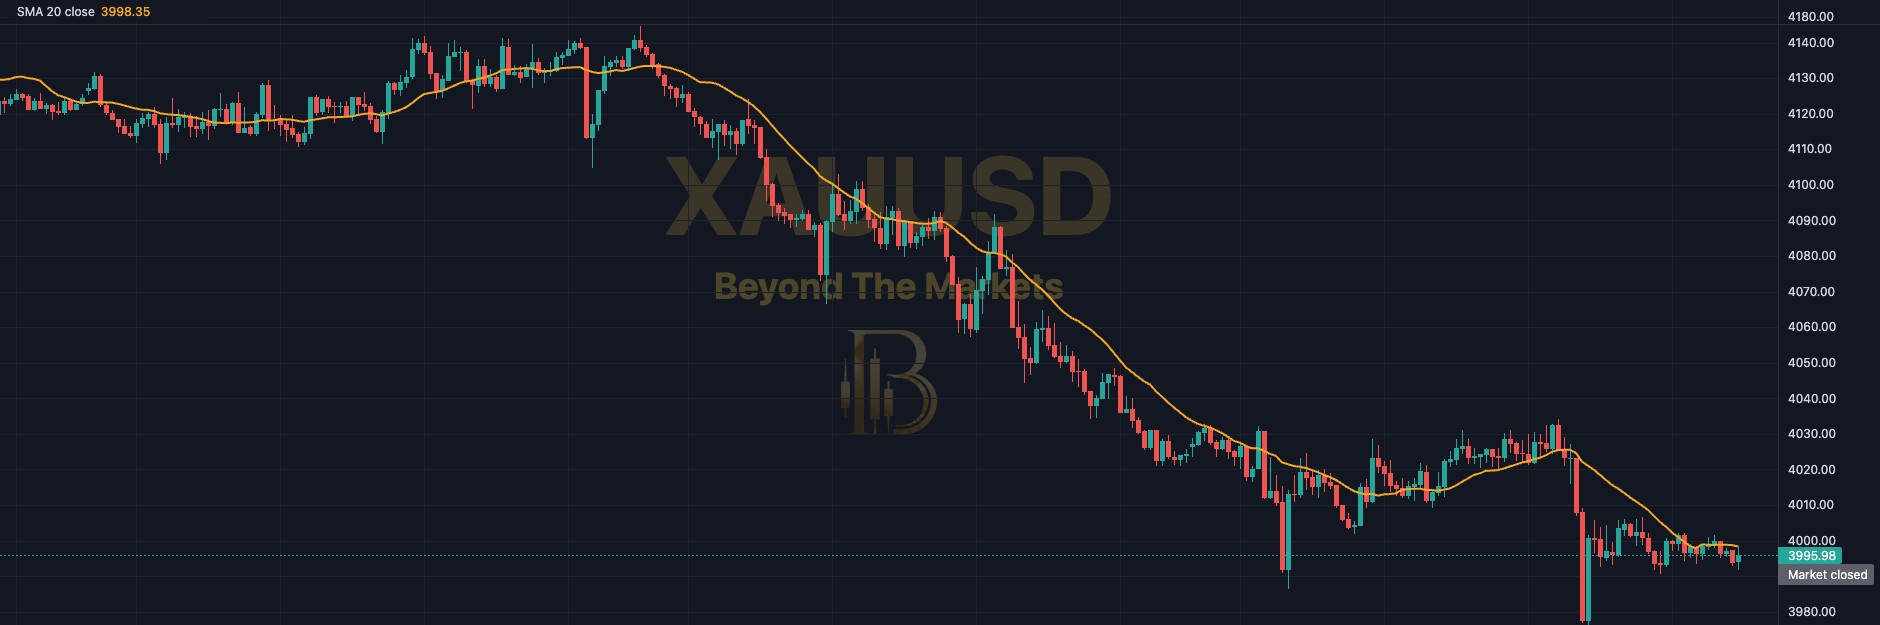 WHAT YOU SEE · GOLD 15m · SMA 20
123456
1Orange line: the SMA 20. Each point is the average close of the last 20 candles.
2Name tag: top left reads SMA 20 close: the length, then the price it averages.
3Price above a rising line: buyers have been in control lately. Think uptrend.
4Price below a falling line: sellers have been in control lately. Think downtrend.
5Flat line, price weaving: no clear trend. The SMA helps least here.
6A cross: a candle closes on the other side of the line. This is what the alerts watch for.
Use it in 5 steps
- Switch it onOpen Charts → Basic Indicators (ƒx) → tick Moving Average (SMA). An orange line appears on the price chart.
- Read the slopeLine rising with price above it: look for buys. Line falling with price below it: look for sells. Flat line: stand aside.
- Wait for pullbacksIn an uptrend, price may dip back to the line. Wait for a candle to close back up before thinking of a buy. Sells: the mirror image.
- Stop beyond the swingPut your stop loss past the recent swing low (or high), not right on the line. Price can poke through it briefly.
- Know SMA from EMAThe SMA gives all 20 candles equal weight. An EMA weights the newest most, so it turns sooner. Steadier line? SMA. Quicker line? EMA.
Reading the line
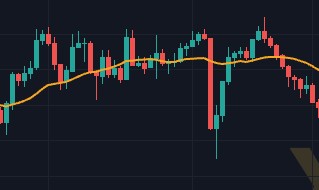
Gold 15m, 21–22 Oct. Candles held above the rising orange SMA 20. Then the line flattened and a candle closed below it: a cross.
⚙ Moving Average (SMA)
Inputs
Length20
Sourceclose
Line#F5A623
Line width2
Settings worth knowing
- Length (20): how many candles are averaged. Bigger = smoother but slower to turn.
- Source (close): which price is averaged. hl2 is the middle of each candle; close is the usual choice.
- Line colour is on Inputs; Line width is on the Style tab.
- Alerts tab: switch alerts on, then pick price crossing above or below the SMA.
- It can only be added once. For several averages at once, use 3 Moving Averages.
Golden rules
- It lags. An average only uses past candles, so it always turns after price has.
- A cross is not a signal on its own. In a sideways market price crosses back and forth.
- Never skip the stop loss. Risk 1% of your account or less per trade.
- Practise first with the Replay button: play old candles forward and trade them for free.
🔔 Get told when it fires: click Alerts, choose Moving Average (SMA) and tick “Price crosses above the SMA” or “Price crosses below the SMA”.
For educational purposes only. The results in this guide come from testing on past prices. Past performance does not guarantee future results, and real spreads, slippage and delays can make results worse. Nothing here is financial advice, and trading carries a high risk of losing money. Read the risk warning.