



INDICATOR · BEGINNER GUIDE
PRICE ACTION
Labels the swing highs and lows, marks trend breaks and buy / sell zones, then flags setups at those zones.
◆HH / HL / LH / LL swings◆2 zones per side◆Setups on closed candles◆Sensitivity: Medium (10 candles)
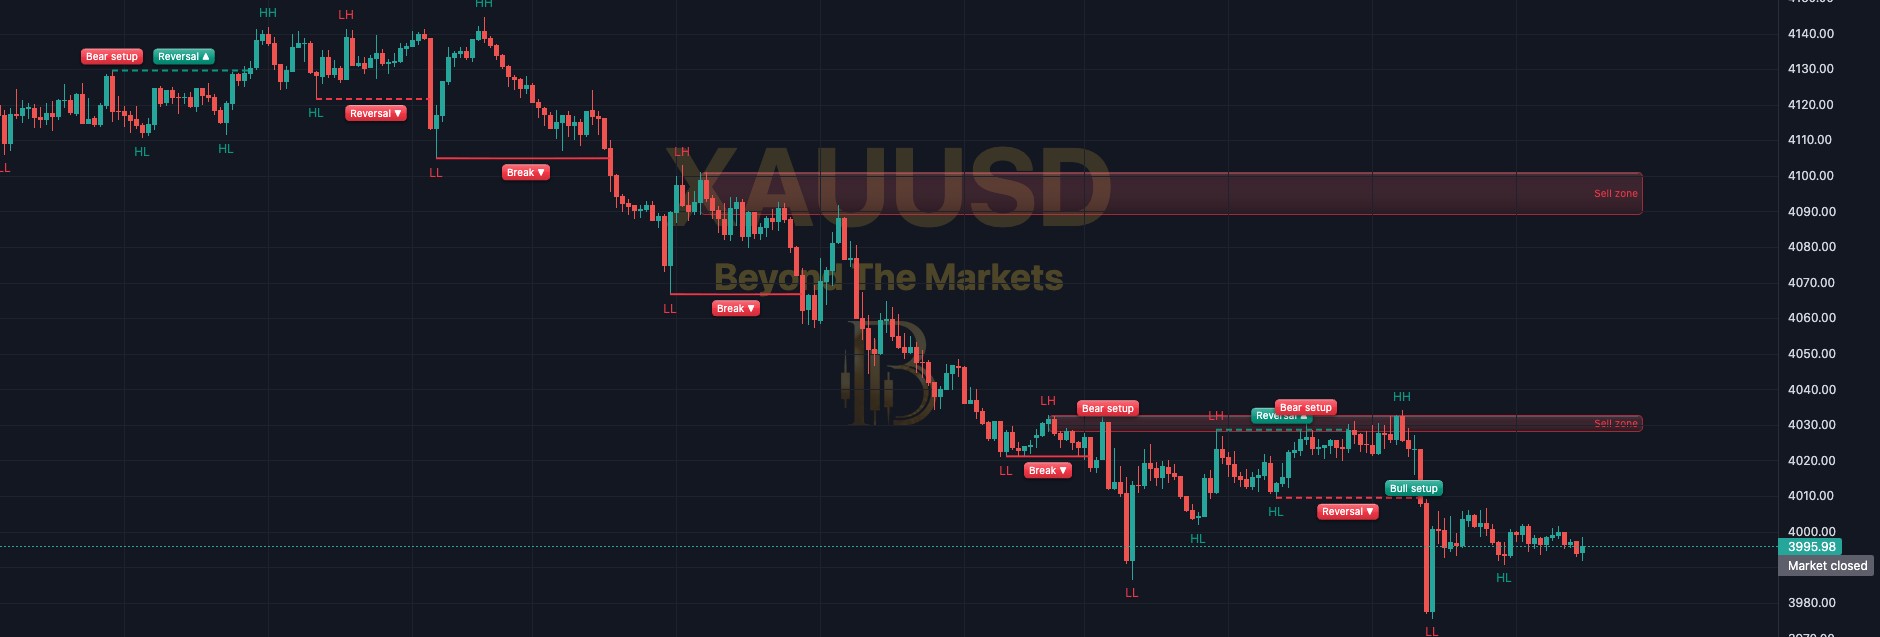 WHAT YOU SEE · GOLD 15m
12345
1Swing labels: HH / HL = higher highs and lows (uptrend). LH / LL in red = lower ones (downtrend).
2Break line: price closed past the last swing. The trend carries on: Break ▲ up, Break ▼ down.
3Reversal line: a dashed break against the old trend, so the trend has flipped.
4Buy / sell zones: green Buy zone = the candle the up move started from. Red Sell zone = the mirror.
5Setup label: Bull setup = a strong candle at a buy zone in an uptrend. Bear setup (red) is the mirror.
6Info panel: the trend right now and what to look for.
Use it in 5 steps
- Switch it onOpen Charts → Basic Indicators → tick Price Action Toolkit. Swing labels, break lines and zones appear on the price chart.
- Read the trendHH and HL labels = uptrend. LH and LL = downtrend. The panel’s Trend row sums it up: UP ▲, DOWN ▼ or UNCLEAR.
- Find the right zoneIn an uptrend, look for buys at a green Buy zone. In a downtrend, sells at a red Sell zone. The Look for row says which.
- Wait for a setupA Bull setup needs an engulfing or pin-bar candle (a strong turn candle) to close at a buy zone, with the trend. Bear setups mirror it.
- Plan your own stopIt draws no stop or target, so plan your own, for example just past the far side of the zone. A zone vanishes once price closes through it.
Reading a setup
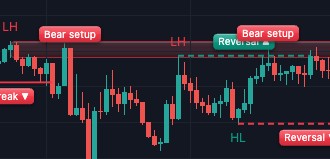
Gold 15m, 23 Oct. In a downtrend, price rallied into the red Sell zone and the Bear setup labels appeared over the candles that turned down there.
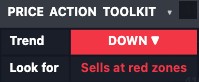
The info panel
- Trend: UP ▲ after a close above a swing high, DOWN ▼ after a close below a swing low.
- UNCLEAR (grey) means no break yet. The Look for row then says “Wait for a break”.
- Look for: “Buys at green zones” in an uptrend, “Sells at red zones” in a downtrend.
- Sensitivity (in ⚙ settings): High uses 5-candle swings, Medium 10, Low 20. Low = fewer, bigger swings.
- Click the title to collapse it; drag its grip to move it.
Golden rules
- Wait for the close. A Break line on the live candle can vanish. Setups only show on closed candles.
- Never skip the stop loss. Risk 1% of your account or less per trade.
- Swings show late: on Medium, 10 candles after the swing. That is normal.
- Practise first with the Replay button: trade old candles for free.
🔔 Get told when it happens: click Alerts, choose Price Action Toolkit and tick “Bull setup (bullish candle at a buy zone, trend up)” and “Bear setup (bearish candle at a sell zone, trend down)”.
For educational purposes only. The results in this guide come from testing on past prices. Past performance does not guarantee future results, and real spreads, slippage and delays can make results worse. Nothing here is financial advice, and trading carries a high risk of losing money. Read the risk warning.