



INDICATOR · BEGINNER GUIDE
REVERSAL PATTERNS
Finds head & shoulders, triple and double tops and bottoms, then signals only when a candle closes through the neckline.
◆H&S, triple and double◆Only big patterns (3.5 ATR)◆Strength score out of 8◆Closed candles, no repainting
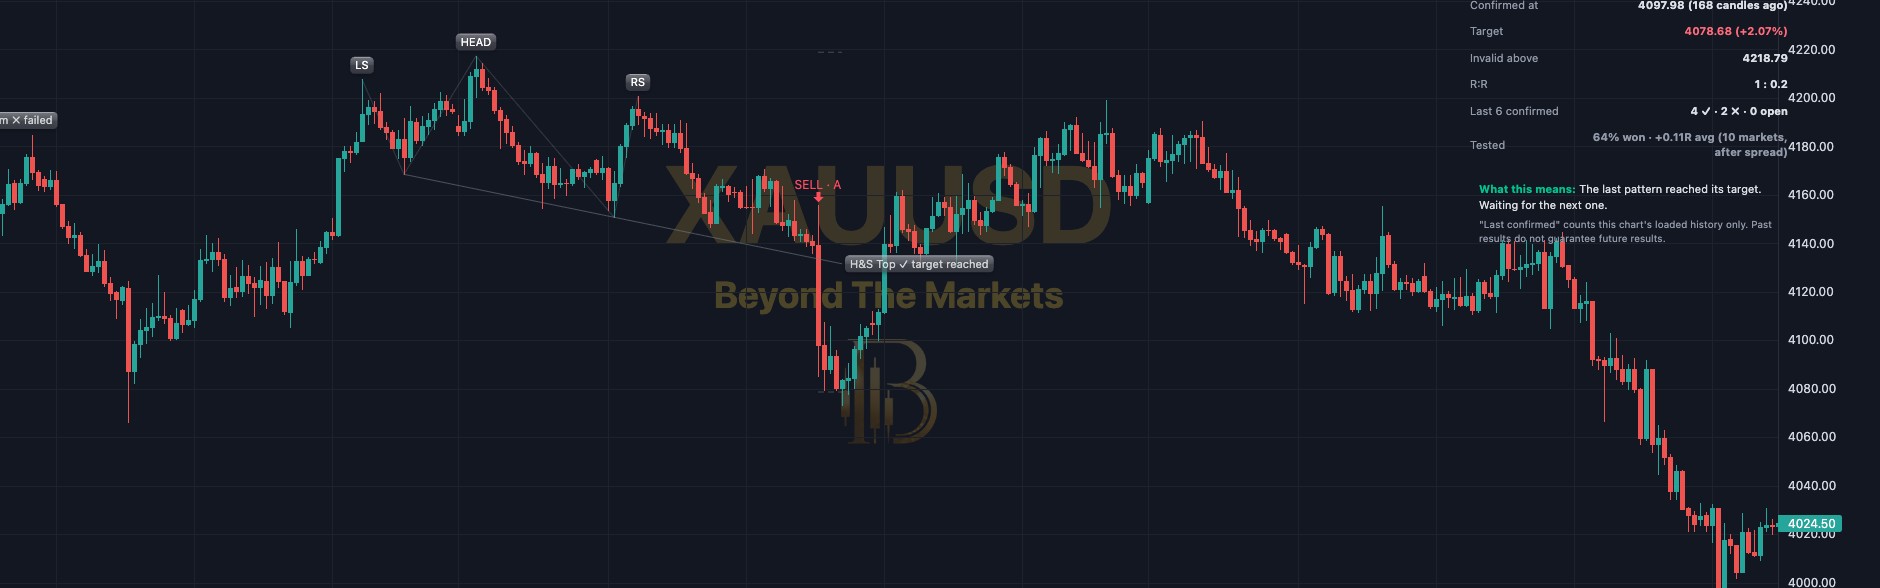 WHAT YOU SEE · GOLD 1H
123456
1Peak tags: the turning points: LS, HEAD, RS for head & shoulders, 1 2 3 or 1 2 for triple or double.
2Outline: a thin zig-zag joining the peaks and dips, so you can see the shape.
3Neckline + status tag: the line price must close through. The tag at its end says what stage it is at.
4Colours: amber = forming, red = confirmed top, green = confirmed bottom, grey = finished.
5BUY / SELL arrow: the neckline broke on a closed candle. The letter is the grade: A, B or C.
6Invalid and Target lines: red dashed Invalid = where the idea is wrong (stop). Green dashed Target = the measured move.
Use it in 5 steps
- Switch it onOpen Charts → Basic Indicators → tick Reversal Pattern Tracker. The dashboard sits top right. Only big, clean patterns show, so be patient.
- Watch it formAn amber pattern is still forming. Nothing to do yet: its tag gives the neckline price that must break.
- Wait for the closeA BUY or SELL comes only when a candle closes through the neckline. The pattern turns green (bottom) or red (top).
- Use the levels drawnInvalid = stop, beyond the head or highest peak. Target = the pattern’s height measured from the neckline. Check R:R in the dashboard.
- Follow it to the endThe tag ends as ✓ target reached, ✗ failed or expired (no neckline break within 40 candles). Grey = finished.
Reading a pattern
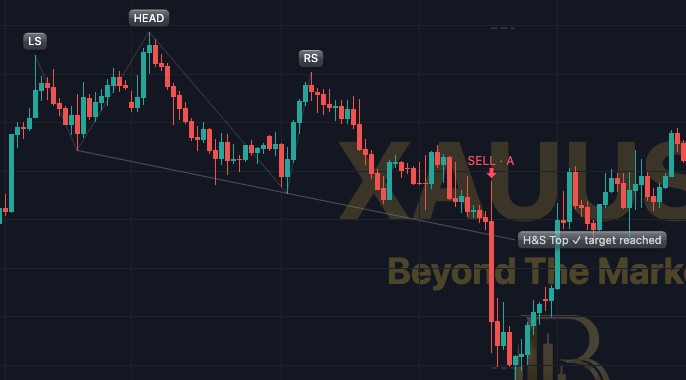
Head and shoulders top on Gold 1H, 9–15 Oct. LS, HEAD and RS mark the three peaks. A close under the neckline gave SELL · A, and the tag now reads ✓ target reached.
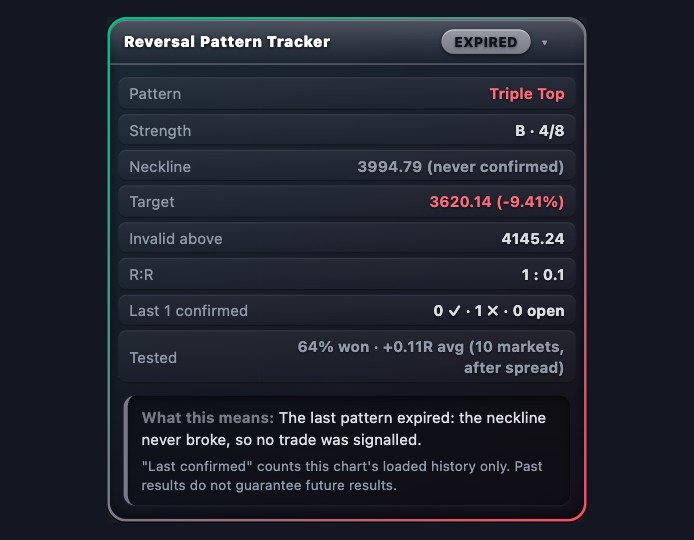
The dashboard
- Status pill: FORMING, CONFIRMED, TARGET HIT, FAILED or EXPIRED.
- Strength: grade A, B or C and a score out of 8. In testing the grade did not predict results.
- Neckline / Confirmed at: the break price, or where it confirmed.
- Target, Invalid, R:R: the plan in prices, and the reward compared with the risk.
- Last confirmed counts wins and losses on this chart. Tested shows the maker’s result.
Golden rules
- Don’t jump in early. Wait for the closed candle through the neckline.
- Never skip the stop loss. About 1 in 3 test trades lost. Risk 1% of your account or less.
- Don’t pick by grade. In testing the grade did not predict results.
- Practise first with the Replay button: trade old candles for free.
🔔 Get told when it happens: click Alerts (the bell), choose Reversal Pattern Tracker and tick “BUY: bullish pattern confirmed” and “SELL: bearish pattern confirmed”.
For educational purposes only. The results in this guide come from testing on past prices. Past performance does not guarantee future results, and real spreads, slippage and delays can make results worse. Nothing here is financial advice, and trading carries a high risk of losing money. Read the risk warning.