



INDICATOR · BEGINNER GUIDE
SESSION HIGH & LOW
Marks the high and low of the Asia, London and New York sessions, with lines that run on after each session ends.
◆Asia, London, New York◆Last 3 of each session◆Lines run 3 hours on◆Charts up to 1 hour
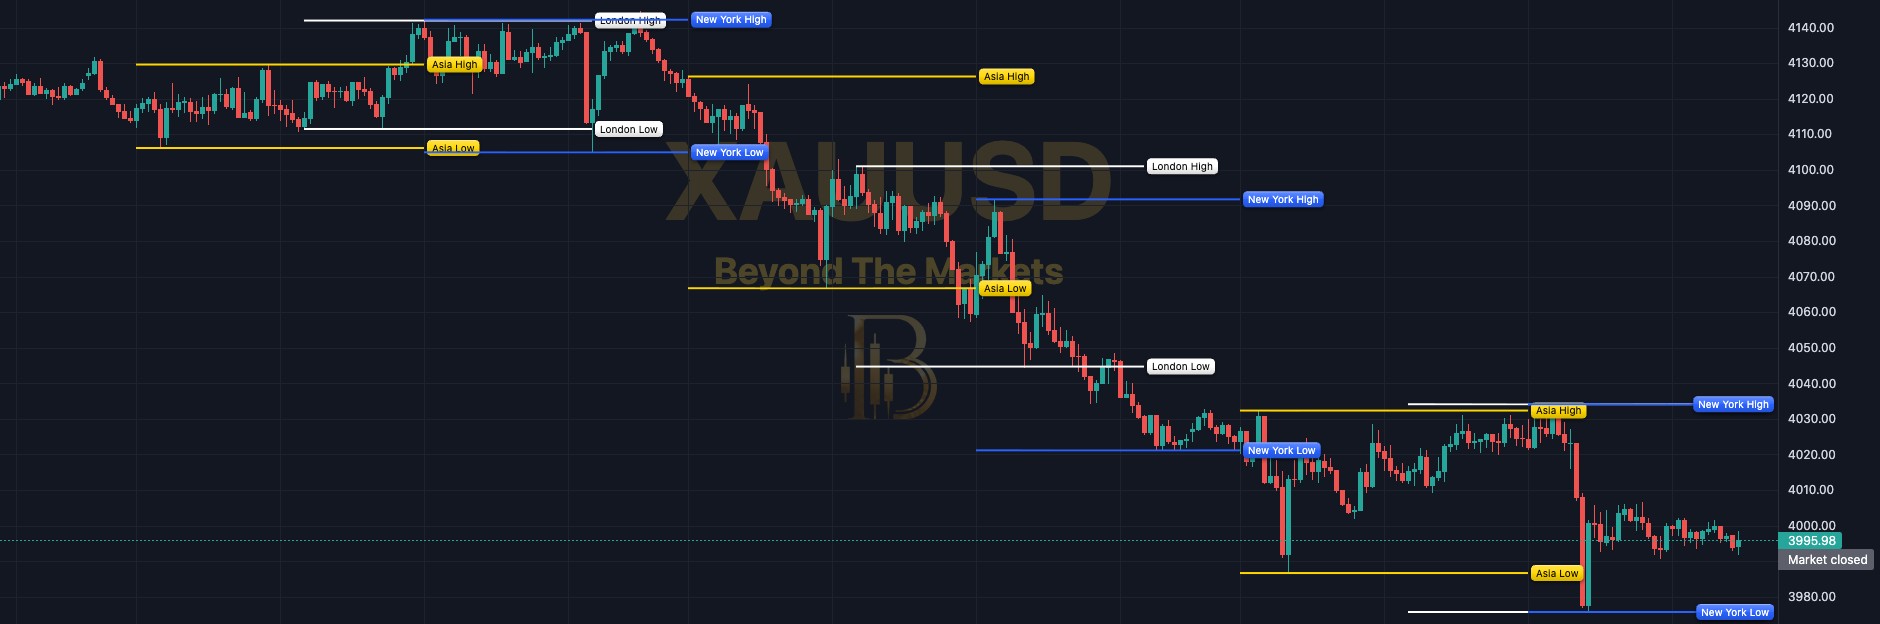 WHAT YOU SEE · GOLD 15m
123456
1Yellow lines: the Asia session’s high and low, tagged Asia High and Asia Low.
2White lines: the London session’s high and low, tagged London High and London Low.
3Blue lines: the New York session’s high and low, tagged New York High and Low.
4Line length: each line starts when its session opens and runs on for 3 hours after it closes.
5Session happening now: its lines reach the latest candle and move as price makes a new high or low.
6Earlier sessions: the last 3 of each session stay on the chart, including today’s, so you can compare.
Use it in 5 steps
- Switch it onOpen Charts → Basic Indicators → tick Session Highs & Lows. Use a 1-hour chart or lower: above that nothing is drawn.
- Know the session timesAsia 09:00–18:00 Tokyo time, London 08:00–17:00 UK time, New York 08:00–17:00 New York time. Summer time is handled for you.
- Note the last high and lowWhen a new session starts, see where the last session’s high and low sit. They are levels to watch: price may turn there or break through.
- Wait for the closeA close above a session high or below a session low is a break. A wick through that closes back inside is not.
- Plan your stopIf you trade a break or a turn, put your stop on the other side of the level. The lines are context, not entries.
A session level at work
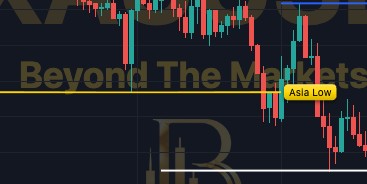
Gold 15m, 22 Oct. Price fell to the Asia Low (yellow) during the London session. Candles then closed below it and the slide carried on.
⚙ Session Highs & Lows
Sessions (starts – ends, city clock)
Asia09:00 – 18:00 Tokyo
London08:00 – 17:00 London
New York08:00 – 17:00 New York
Lines
Lines run until3 h after the session ends
Sessions to show (of each)3
Show on timeframes up to1H
Show the price on the labelsOff
Settings worth knowing
- Starts, Ends and Time zone: change any session’s hours. Each one follows its own city’s clock.
- Lines run until: 3 hours after the session ends (default), until price touches it, or to the latest candle.
- Sessions to show: 3 of each by default, including the one happening now.
- Show on timeframes up to: 1H by default. Pick 4H to see the lines on 4-hour charts.
- Show the price on the labels: off by default. Tick it to add each level’s price to its tag.
Golden rules
- A session line is a level, not a signal. Wait for a candle to close beyond it.
- Never skip the stop loss. Risk 1% of your account or less per trade.
- Skip big news times (rate decisions, NFP): price can rip through every session level at once.
- Practise first with the Replay button: play old candles forward and trade them for free.
🔔 Get told when it happens: click Alerts (the bell), choose Session Highs & Lows and tick “A candle closes above a session high” and “A candle closes below a session low”.
For educational purposes only. The results in this guide come from testing on past prices. Past performance does not guarantee future results, and real spreads, slippage and delays can make results worse. Nothing here is financial advice, and trading carries a high risk of losing money. Read the risk warning.