



INDICATOR · BEGINNER GUIDE
STOCHASTIC
Shows if price is near the top or bottom of its recent range, and marks BUY and SELL crosses with the trend.
◆Classic 14, 3, 3 setting◆Overbought 80 · Oversold 20◆Signals only with the trend◆Plain-English info panel
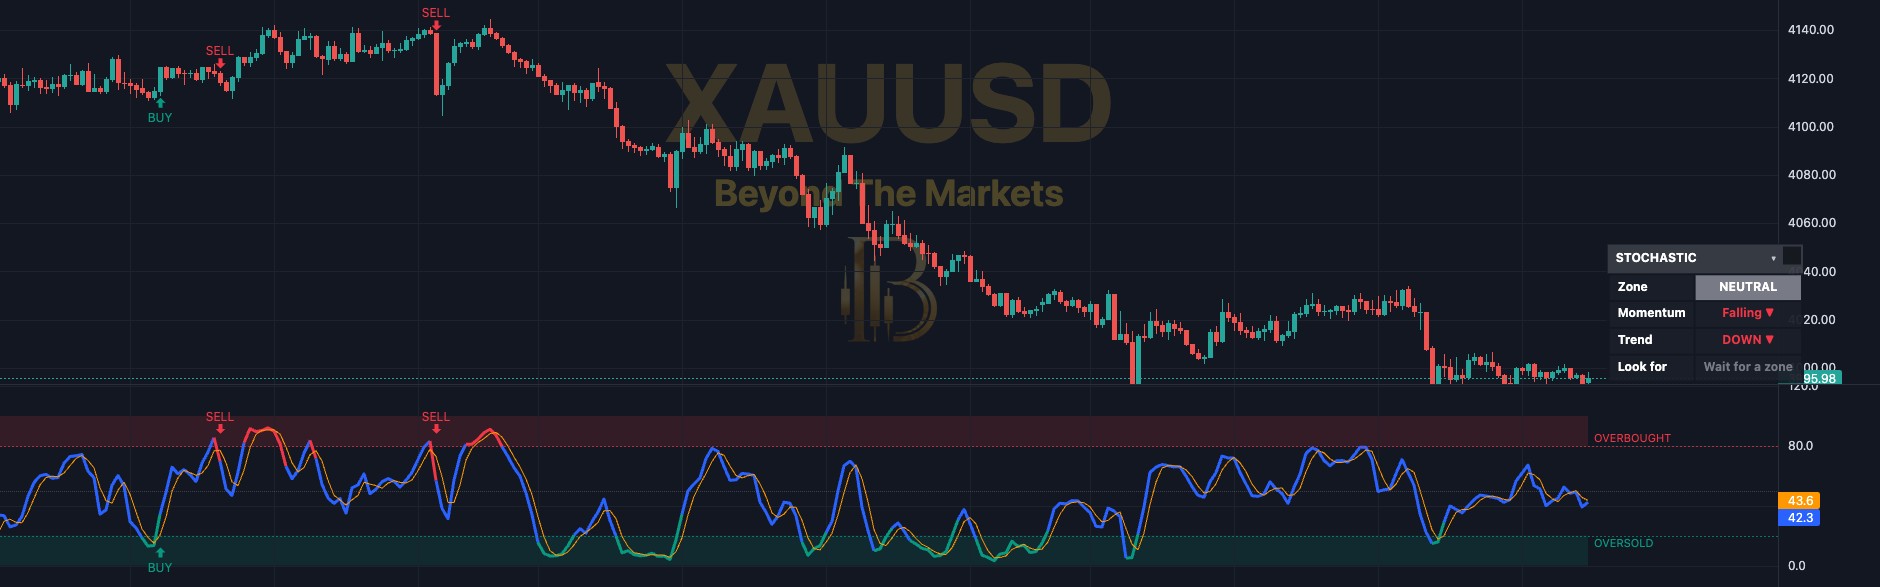 WHAT YOU SEE · GOLD 15m · PRICE + STOCHASTIC PANE
123456
1Blue line: the main line. 0 to 100: where price closed within the last 14 candles’ range.
2Orange line: the signal line, a slower copy of the blue line. Crosses between them are the signals.
3Top zone (80+): OVERBOUGHT. Price has risen a lot recently and may be due a pullback.
4Bottom zone (20 and below): OVERSOLD. Price has fallen a lot recently and may be due a bounce.
5BUY / SELL arrows: green BUY = cross up from oversold, red SELL = cross down from overbought.
6Info panel: the zone, momentum and trend in words, plus what to look for next.
Use it in 5 steps
- Switch it onOpen Charts → Basic Indicators → tick Stochastic (Beginner Friendly). It opens in its own pane under the chart, scaled 0 to 100.
- Check the trend firstThe panel’s Trend row says UP or DOWN against the 50-candle average. BUYs only show in an uptrend, SELLs only in a downtrend.
- Wait for a zoneIn an uptrend, wait for the line to dip into the OVERSOLD zone. In a downtrend, wait for OVERBOUGHT.
- Wait for the crossBUY appears when the blue line crosses up over the orange line from oversold, once the candle closes. SELL is the mirror image.
- Plan the exitPut your stop loss beyond the recent swing low (for a BUY) or high (for a SELL). Strong trends can stay overbought or oversold for long.
Reading a signal
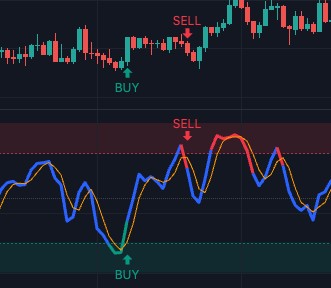
BUY on Gold 15m, 21 Oct. The blue line dipped into the green oversold zone, then crossed back up through the orange line. The same BUY shows on the price chart above.
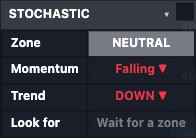
The info panel
- Zone: OVERBOUGHT (red), OVERSOLD (green) or NEUTRAL (grey) right now.
- Momentum: Rising ▲ when the blue line is above the orange line, Falling ▼ when below.
- Trend: UP ▲ or DOWN ▼: price above or below the 50-candle average.
- Look for: the next thing to wait for, e.g. “Wait for a BUY cross” or “Oversold, but trend is down”.
- Click the title bar to hide it. Drag it by its grip to move it.
Golden rules
- Overbought is not a sell signal. In a strong uptrend price can stay up there. Wait for the cross.
- Keep “Only show signals with the trend” on. The settings call it strongly recommended for beginners.
- Never skip the stop loss. Risk 1% of your account or less per trade.
- Practise first with the Replay button: play old candles forward and trade the crosses for free.
🔔 Get told when it fires: click Alerts (the bell), choose Stochastic (Beginner Friendly) and tick “BUY signal (cross up out of oversold)” and “SELL signal (cross down out of overbought)”.
For educational purposes only. The results in this guide come from testing on past prices. Past performance does not guarantee future results, and real spreads, slippage and delays can make results worse. Nothing here is financial advice, and trading carries a high risk of losing money. Read the risk warning.