



INDICATOR · BEGINNER GUIDE
VOLUME & VOLATILITY
Shows where the day traded and how fast the market is moving, plus one tested “80% rule” signal a day.
◆Daily volume profile◆Market speed meter◆80% rule signal◆Position size worked out
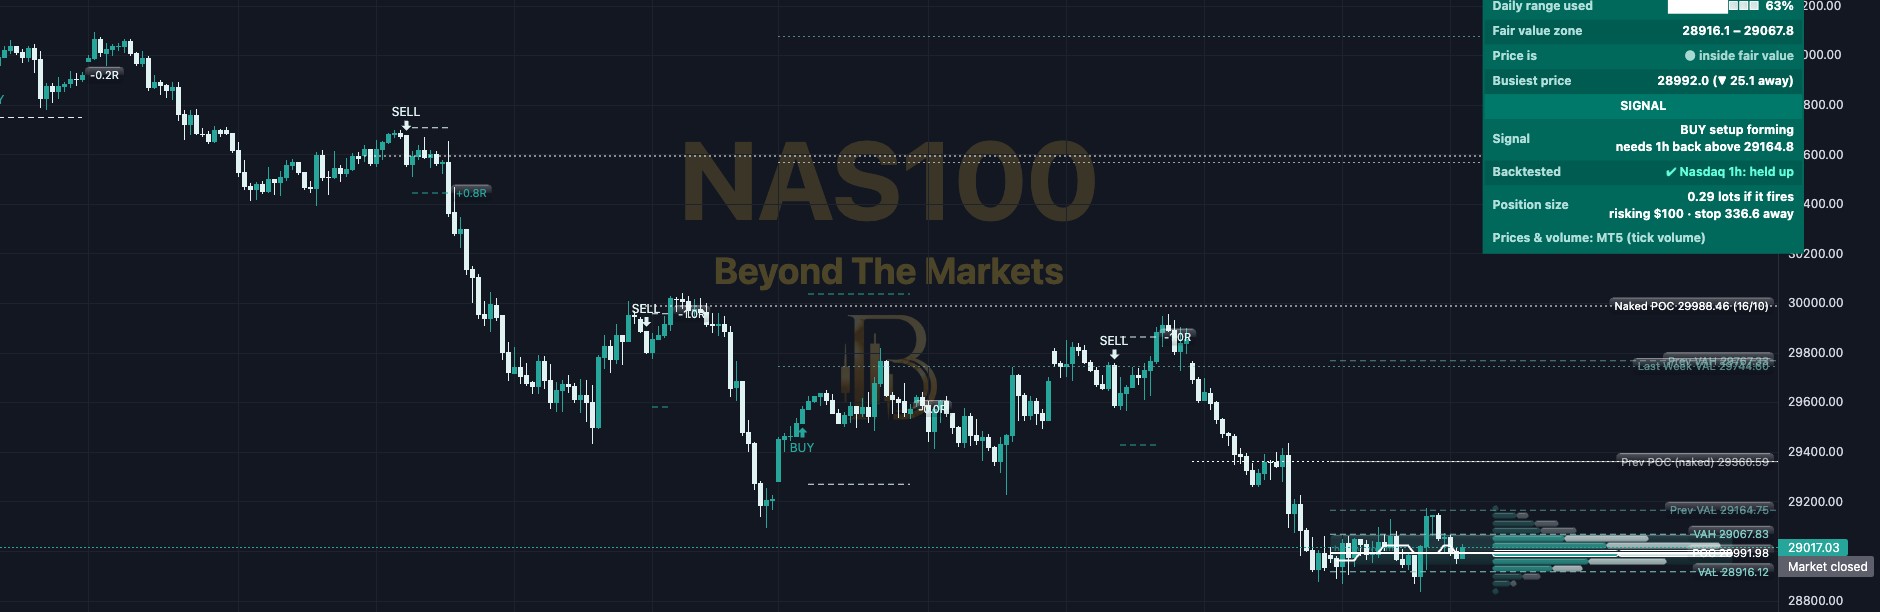 WHAT YOU SEE · NAS100 1H
12346
1Candle colours: up candles turn teal, down candles turn pale (almost white).
2The profile: sideways bars of today’s trading. Longer = busier. Teal = buying, pale = selling.
3POC, VAH, VAL: busiest price (white) and the top and bottom of the fair value zone (light teal).
4Older levels: yesterday’s and last week’s levels, and naked POCs: old busiest prices not yet revisited.
5Heavy / thin zones: heavy = lots of trading (price often stalls). Thin = little trading (price often moves fast through).
6BUY / SELL signal: the 80% rule. Teal BUY under a candle, pale SELL over it, with stop and target lines.
Use it in 5 steps
- Switch it onOpen Charts → Basic Indicators → tick Volume and Volatility Screener. Scroll right a little to see the profile past the last candle.
- Read the market summaryThe dashboard says how fast the market is, how busy, how much of the day’s range is used, and where price sits against fair value.
- Use fair value as a mapThe POC often acts like a magnet. Price tends to come back to the fair value zone; leaving it on strong volume can start a trend.
- Wait for the 80% ruleBUY: the day opened below yesterday’s fair value, got back inside and held 60 minutes. Target its top, stop below the day’s low.
- Size the tradeSet your account size and risk in ⚙ Position Size. The Position size row shows the lots. Check one size against your broker first.
Reading a signal
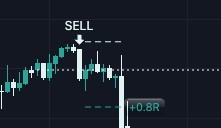
80% rule SELL on NAS100 1H, 14 Oct. The dashed lines show its target and stop. Price fell to the target and the result label reads +0.8R.
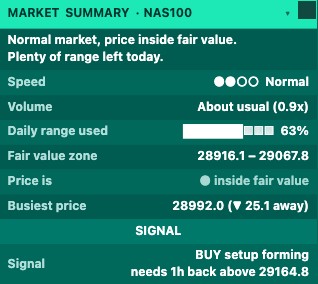
The market summary
- Speed: ●○○○ Quiet to ●●●● Very fast. Faster markets swing further, so stops need more room.
- Volume: busier or quieter than usual for this time of day. Daily range used: near 100%, big new moves are less likely.
- Fair value zone / Price is / Busiest price: the value area, where price sits and how far the POC is.
- Signal: Watching, setup forming, active (with target and stop) or Done for today. Backtested: what testing found here.
- Hover over any row for an explanation. Click the title bar to hide it.
Golden rules
- One signal a day, at most. Do not force trades on days with “No setup today”.
- Check the Backtested row. Held up on Nasdaq 1h; gold is unproven; other markets were not tested.
- Never skip the stop loss. The size is worked out for 1% risk: keep it that way or lower.
- Practise first with the Replay button: play old days forward and follow the signal for free.
🔔 Get told when it fires: click Alerts (the bell), choose Volume and Volatility Screener and tick “80% rule setup forming (early heads-up)” and “80% rule BUY” / “80% rule SELL”.
For educational purposes only. The results in this guide come from testing on past prices. Past performance does not guarantee future results, and real spreads, slippage and delays can make results worse. Nothing here is financial advice, and trading carries a high risk of losing money. Read the risk warning.