



START HERE · BEGINNER GUIDE
USING THE CHARTS
Your map of the members’ charts: markets, indicators, AI scanners, Chart AI, alerts, replay and layouts. Watch the 1-minute tour, then keep this page beside you.
◆40 markets◆48 indicators◆14 AI scanners◆✨ Chart AI◆Up to 4 charts
Your first 5 minutes
- Pick a market and timeframeTop left: e.g. XAUUSD (gold) on 15m. Each candle is 15 minutes.
- Add one toolBasic Indicators or AI Scanners → tick it. Start with one, not five.
- Press ✨ ExplainChart AI tells you in plain English what the chart and your tool are showing.
- Turn on alerts🔔 Alerts → tick your tool. Connect Telegram to get them on your phone.
- Read its guideEvery tool has a one-page guide like this one at /guides.
▶ The 1-minute tour
13 stops in 60 seconds: markets, indicators, scanners, settings, drawing tools, Chart AI, alerts, replay, pop-out, layouts and your trading desk.
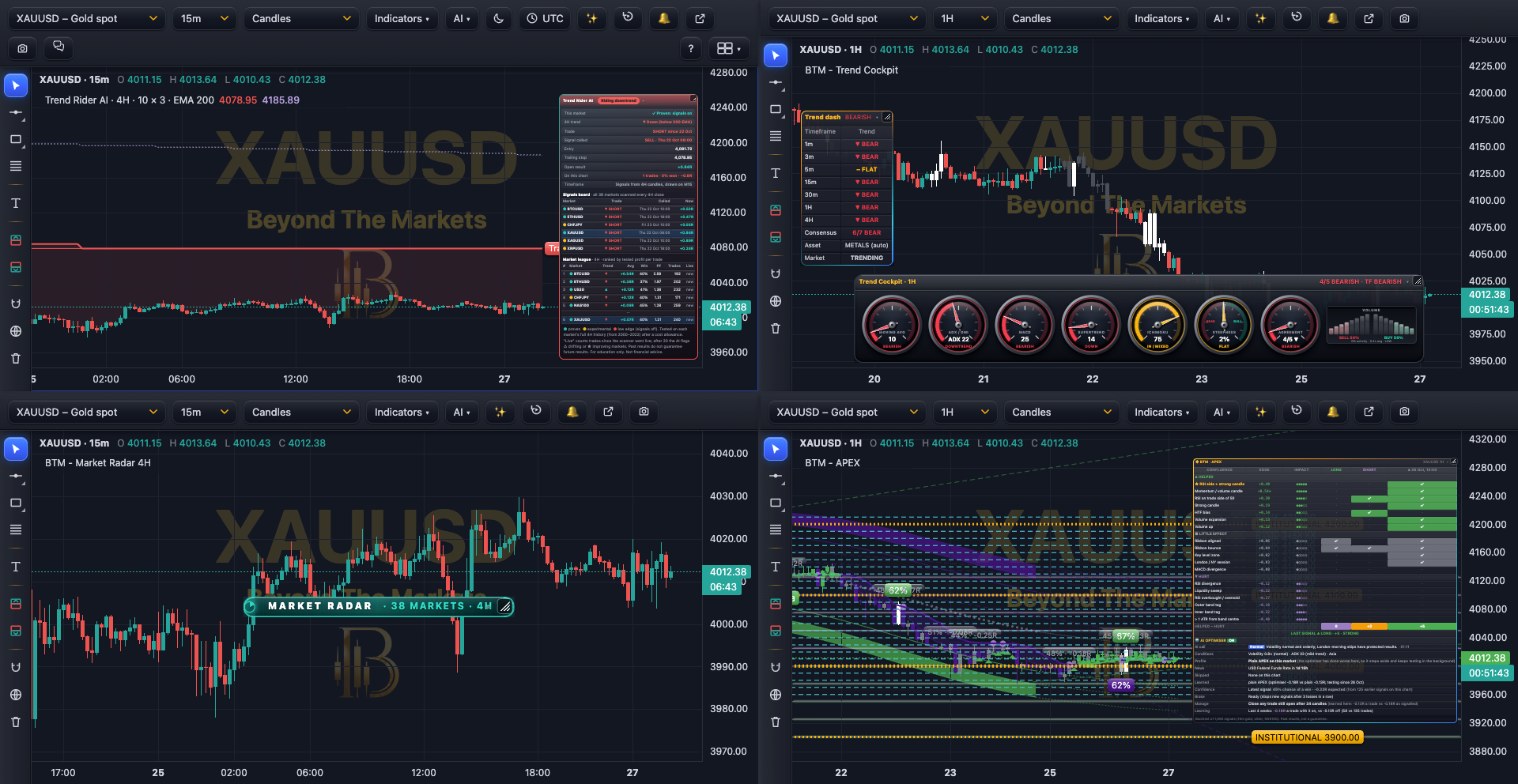
The toolbar at a glance

1Market: 40 markets: forex, gold, silver, indices (incl. the S&P 500), oil, gas and crypto.
2Timeframe: 5-second to monthly candles.
3Chart style: candles, Heikin Ashi, bars, line or area.
4Basic Indicators: 48 tools; ⚙ to change one.
5AI Scanners: 14 scanners with the AI Optimiser built in.
6Theme: change the chart colours.
7Clock: pick the time zone the chart uses.
8✨ Explain: Chart AI reads your chart (10 a day).
9Replay: practise on past prices, candle by candle.
10Alerts: pop-up, sound, desktop and Telegram.
11Pop out: open a chart on its own, e.g. on a second screen.
12📷 Picture: save, copy or add the chart to your journal.
13Chat: talk to other members beside the chart.
+Layout (top right): up to 4 charts. Drawing tools: left edge.
Handy to know
- Double-click a tool on the chart to open its settings.
- Your saved layouts and watchlist follow you to every device.
- Tap a scanner signal, then ⚡ Explain this signal: why it fired, its stop and targets, and what would make it fail.
- Scroll to zoom; drag to move back in time; double-click the price scale to reset it.
- Prices can differ slightly from your broker’s.
Golden rules
- One tool at a time until you know what it shows.
- Practise in Replay before you trade for real.
- Risk 1% or less per trade, with a stop loss.
Tip: lost? Press ? at the top right of the chart, or open the Guides page.
For educational purposes only. The results in this guide come from testing on past prices. Past performance does not guarantee future results, and real spreads, slippage and delays can make results worse. Nothing here is financial advice, and trading carries a high risk of losing money. Read the risk warning.