



INDICATOR · BEGINNER GUIDE
AUTO FIBONACCI
Fibonacci levels drawn automatically on the latest big swing.
◆Finds the swing◆23.6% to 78.6%◆Golden zone◆127.2% · 161.8%
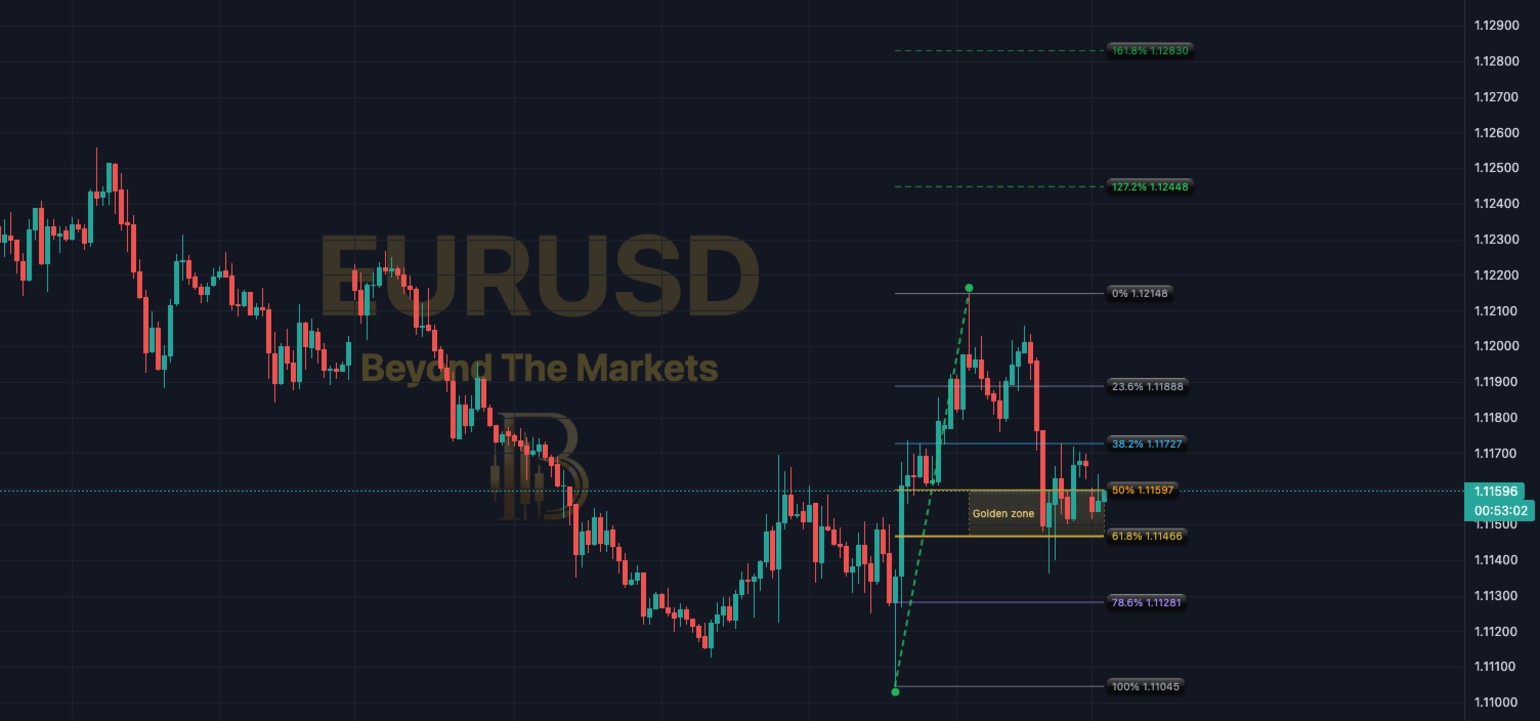 WHAT YOU SEE · EURUSD 1H · 22 OCT–2 NOV
123456
1Green dot (100%): where the swing started.
2Green dot (0%): where the swing ended.
3Levels: how far price has pulled back.
4Gold box: the golden zone, 50% to 61.8%.
578.6%: the last common level.
6Dashed lines: targets past the swing.
Use it in 5 steps
- Switch it onCharts → Basic Indicators (ƒx) → tick Auto Fibonacci.
- Find the swingThe dotted line joins the start and end of the latest big move.
- Wait for a pullbackPrice often pulls back part of the move before carrying on.
- Watch the gold boxMany traders look for the move to carry on from the golden zone. Not always.
- Past 100%?The swing is undone. Wait for a new one to be drawn.
A gold swing that did not hold
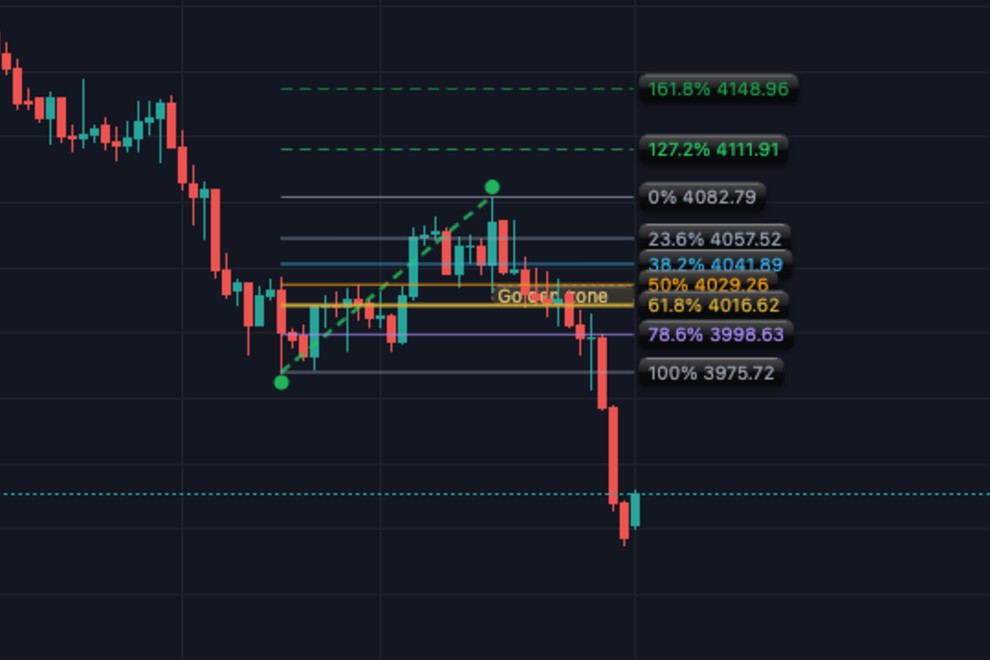
XAUUSD 4H, 23 Oct–2 Nov. An up swing from 3975.72 to 4082.79. Price fell through the golden zone and past 100%, so the swing was undone.
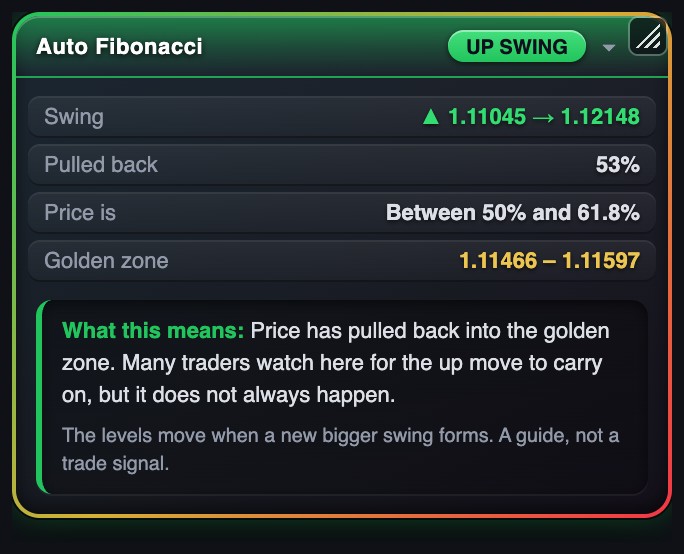
The dashboard
- Swing: up or down, from where to where.
- Pulled back: how much of the move has been given back.
- Price is: which two levels price sits between.
- Golden zone: the 50% to 61.8% prices.
- What this means: the picture in one plain sentence.
Golden rules
- A guide, not a signal. Check the trend and big news first.
- The levels move when a bigger new swing forms.
- Bigger charts (1 hour and up) give cleaner swings.
- Always use a stop loss and risk 1% or less per trade.
🔔 Get told when it fires: click Alerts, choose Auto Fibonacci and tick “Price enters the golden zone”.
For educational purposes only. The results in this guide come from testing on past prices. Past performance does not guarantee future results, and real spreads, slippage and delays can make results worse. Nothing here is financial advice, and trading carries a high risk of losing money. Read the risk warning.