



SNIPER
Graded buy and sell flags with a stop and three targets drawn for you, three trend lines, a Sniper Scope trend card for every timeframe, its own RSI & Divergence pane under the chart and the AI Optimiser built in. Made for quick trades on 1 to 15-minute charts.
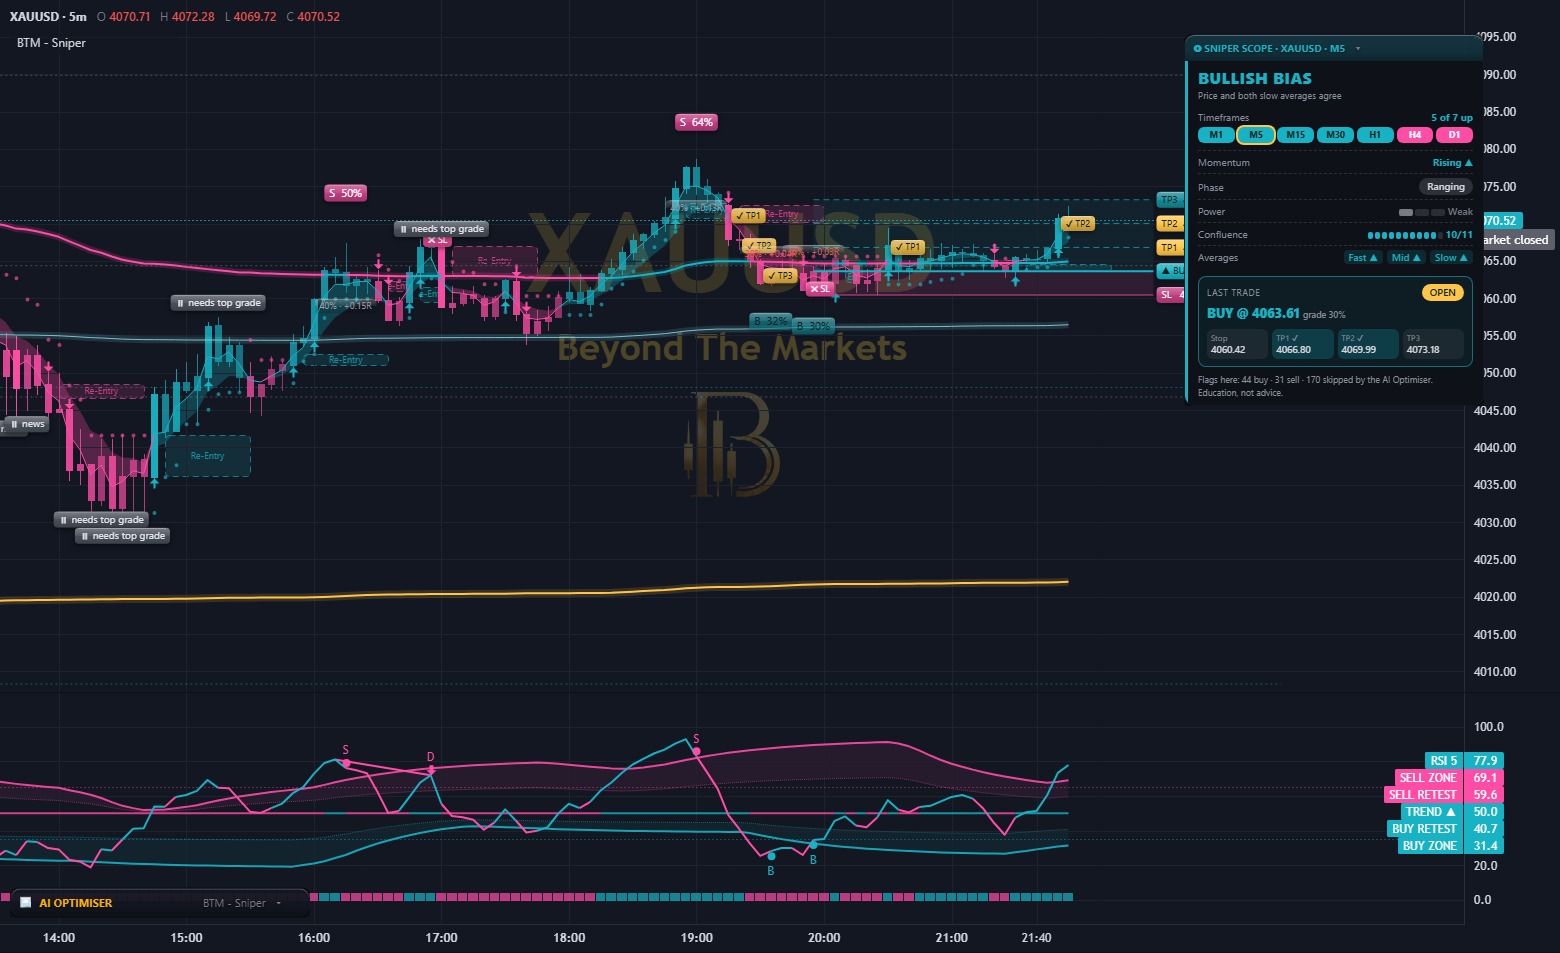 WHAT YOU SEE · XAUUSD 5m · PRICE CHART + RSI PANE
12345678
Use it in 5 steps
- Add itAI Scanners → tick BTM – Sniper. It works on any market; it is built for 1 to 15-minute charts. Its RSI pane opens underneath by itself.
- Check the ScopeMost tiles turquoise and Trending = buys have the wind behind them. No clear bias = be choosy.
- Wait for a flagA B or S appears when a candle closes. Favour ★ 70%+ flags that agree with the Scope.
- Use the levelsStop goes behind the recent swing; the three targets are 1, 2 and 3 times your risk. Many traders bank some at TP1.
- Get the alerts🔔 Alerts → add Sniper to My alerts: new buy, new sell, TP hit, stop hit. Telegram works with the site closed.
When it flags
- B: a fast RSI line bottoms out below 35 and turns back up, on a closed candle.
- S: it peaks above 65 and turns back down.
- The grade mixes how stretched RSI was (30%), how deep into the bands price went (25%), how many of 11 trend checks agree (30%) and the candle’s rejection (15%).
- The AI Optimiser can hold a flag back: news, an AI “Pause”, or “Cautious” (only ★ flags).
Not back-tested yet. Sniper is newer than our other scanners: the AI Optimiser’s confidence on each flag shows how its earlier flags did on your chart, and the learning loop tracks it market by market.
The RSI & Divergence pane (under the chart)
Sniper now comes in two parts: the price chart (flags, stop and targets) and its own RSI pane underneath. The pane shows the exact RSI line that fires the flags, so you can see a flag coming before it lands. Turning on BTM – Sniper switches both on.
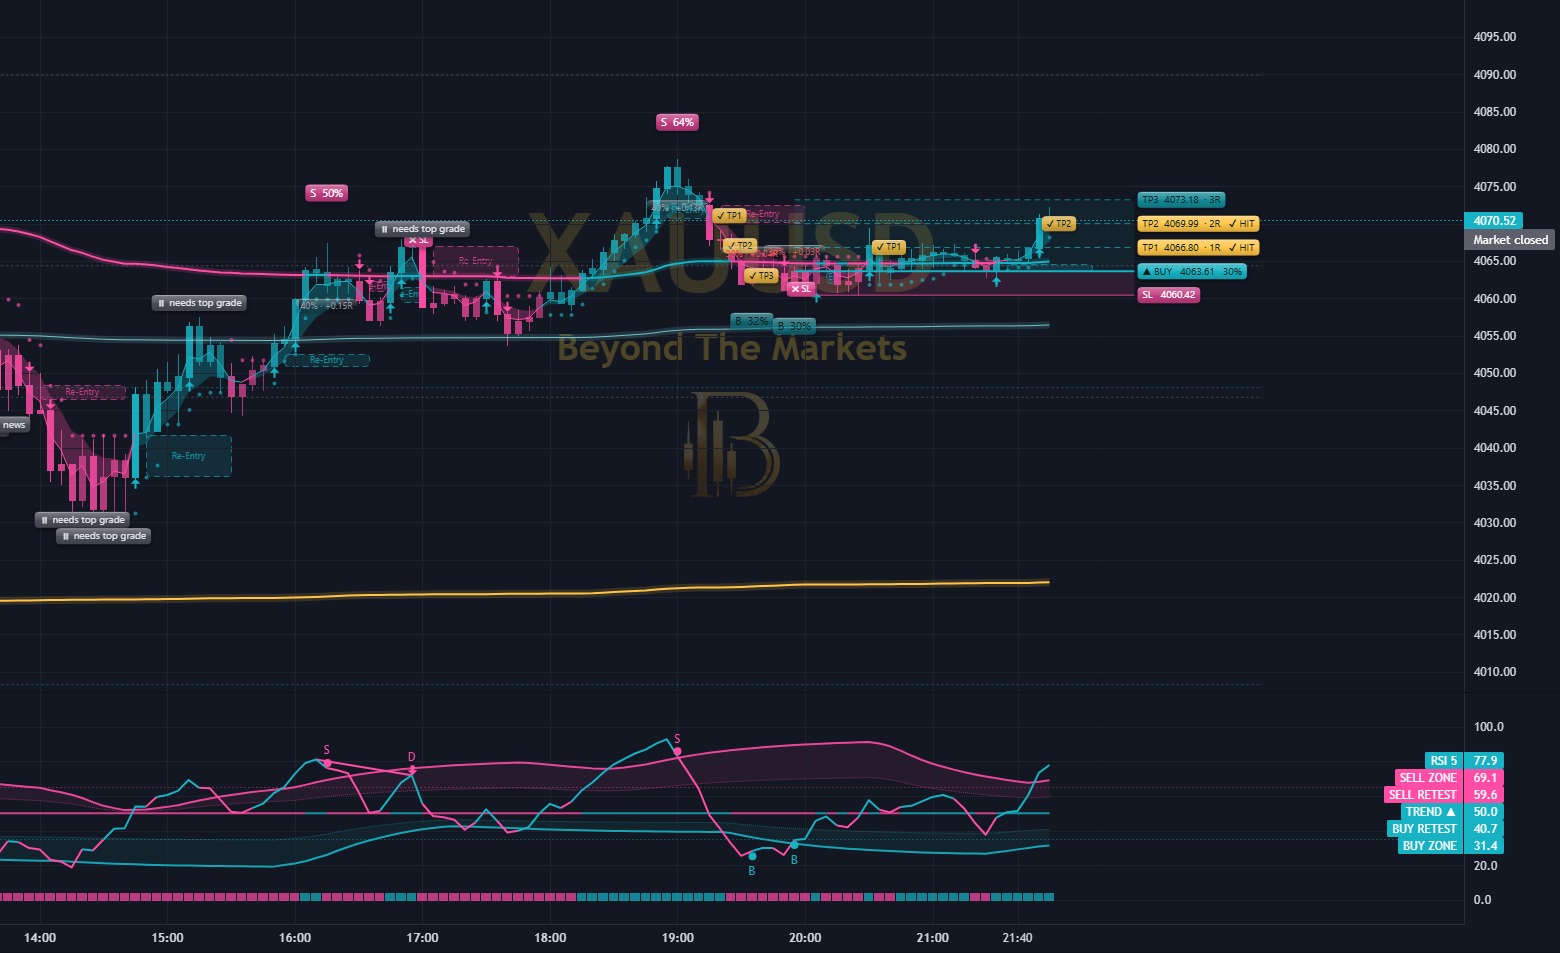 BOTH PARTS · XAUUSD 5m · S 64% ON PRICE = S ON THE RSI LINE
ABCDEFG
Use both parts together
- Trend firstCheck the Sniper Scope, the trend strip and the TREND ▲/▼ tag. Turquoise everywhere = look for buys; pink = look for sells.
- Watch the lineWhen the RSI line pushes into the BUY ZONE (with an up-trend) or the SELL ZONE (with a down-trend), get ready. That is where flags come from.
- Take the flagThe B or S lands on a closed candle, on the price chart and the RSI line together. Favour ★ 70%+.
- Look for the DA flag that says D (for example “S 64% D”) lines up with a divergence: momentum was already fading. These are the strongest.
- Manage itUse the stop and targets on the price chart. In a buy, RSI dipping to BUY RETEST and turning up = still healthy; RSI falling through the TREND line at 50 = momentum gone, think about banking profit.
Reading the RSI pane
- RSI 5 line: turquoise while rising, pink while falling. It is the same line the B / S flags use.
- Dashed lines at 65 and 35: a turn back from beyond these lines is what fires S and B.
- Retest lines (dotted) sit halfway between each zone and 50: pullbacks often turn there.
- A D is confirmed 2 candles after the swing, so it appears slightly late on purpose and does not move afterwards.
- Want it hidden? ⚙ → RSI & Divergence pane under the chart. The flags stay on the price chart.
Good to know
- Fewer, better flags: ⚙ → Hide flags graded below % = 50 or 70.
- The re-entry boxes after a break arrow show where price may come back for a second chance.
- On 15m and above it also marks fair value gaps, plus key levels and R1–S7 pivots on every chart.
Good questions for ✨ Explain
- “What is Sniper’s latest flag and how strong is it?”
- “Do the timeframes agree with this trade?”
- “Where are the stop and targets?”
Golden rules
- Not every flag is a trade: grade and trend first.
- Never move the stop further away.
- Risk 1% or less per trade.
For educational purposes only. The results in this guide come from testing on past prices. Past performance does not guarantee future results, and real spreads, slippage and delays can make results worse. Nothing here is financial advice, and trading carries a high risk of losing money. Read the risk warning.