



AI SCANNER · BEGINNER GUIDE
BTM INTEL PRO
Shows the trend on seven timeframes at once and draws a confirmed BUY or SELL plan with stop loss and two targets.
◆Dashboard from M1 to Daily◆M15 and H1 must agree◆Targets at 1× & 2× risk◆Banking, institutional, retail levels
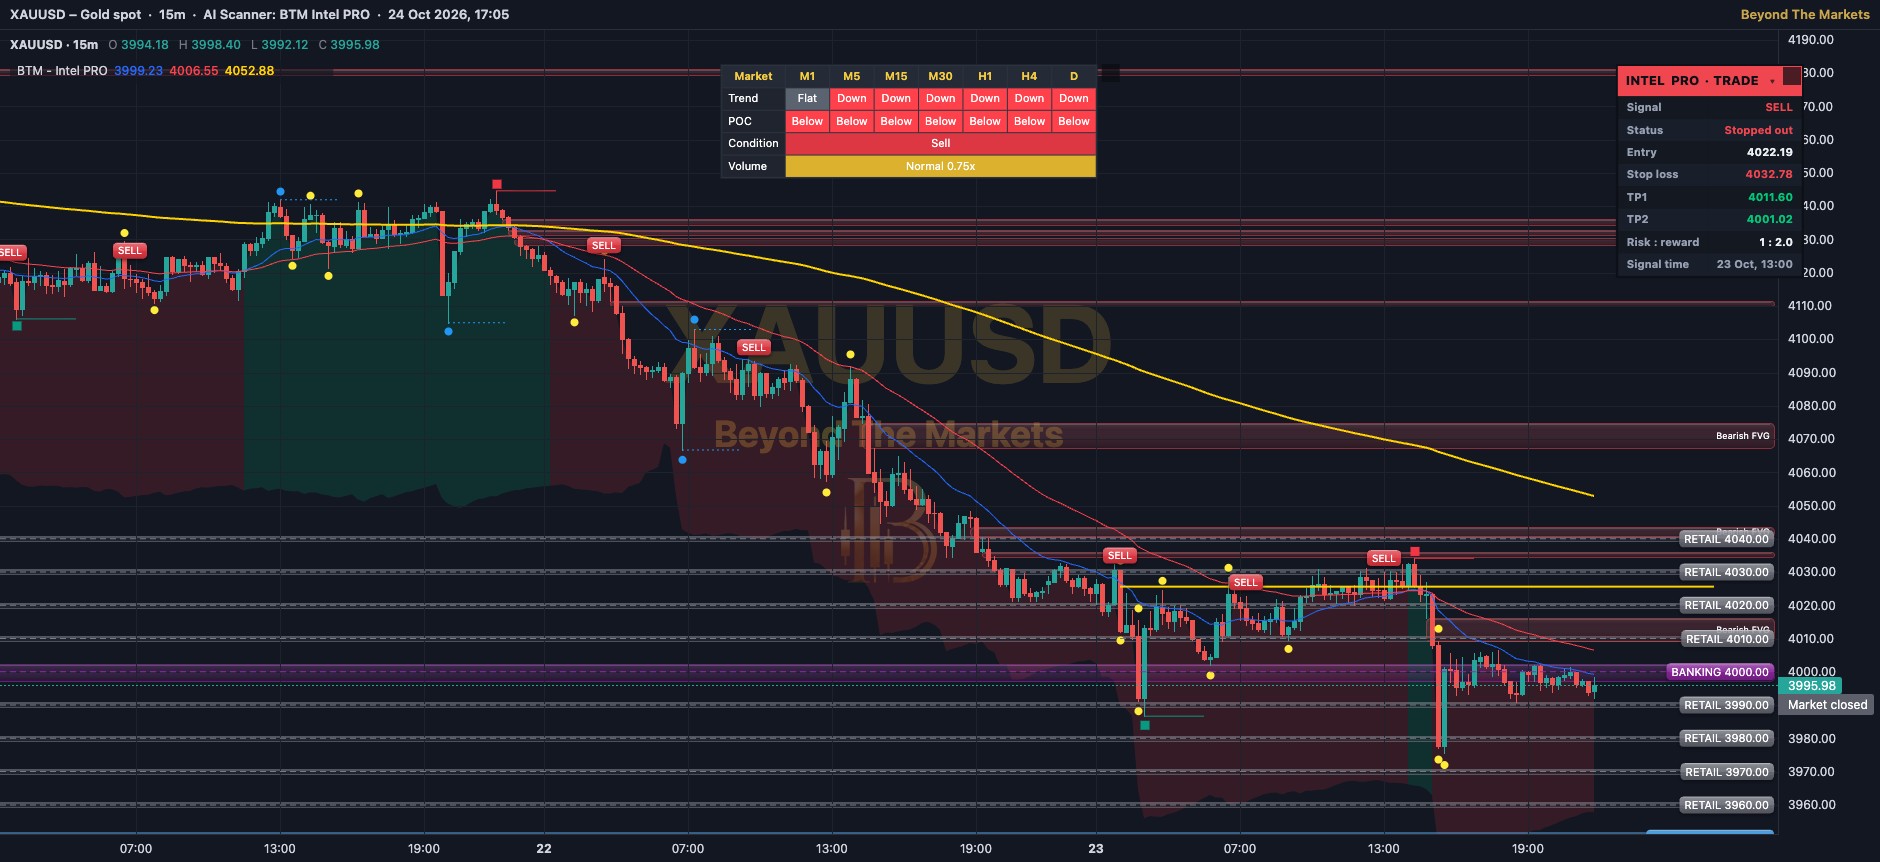 WHAT YOU SEE · GOLD 15m
123456
1Blue, red & yellow lines: moving averages (average-price lines) over 20, 50 and 238 candles. The thick yellow one is the long-term trend.
2Shading under candles: green = uptrend (20 line above 50 line), red = downtrend.
3Swing dots & squares: mark turning points. Yellow = small, blue = medium, red/green squares = big tops/bottoms. They appear after price turns.
4BUY / SELL label: green BUY under a candle or red SELL over it = a confirmed trade idea, drawn when the candle has closed.
5Round-number zones: price bands where big orders often sit. Purple BANKING = biggest, blue INSTITUTION, grey RETAIL = smallest.
6FVG boxes: gaps left by a fast move (fair value gaps). Each box disappears once price touches it.
Use it in 5 steps
- Switch it onOpen Charts → AI Scanners → tick BTM – Intel PRO. A 15-minute chart works well, for example XAUUSD (gold).
- Read the dashboardThe table at the top shows the trend on every timeframe. Up on both M15 and H1 favours buys; Down on both favours sells.
- Wait for BUY or SELLA label appears when the trend agrees, volume is normal or better, and a candle dips to the blue 20 line and closes back with the trend.
- Use the plan drawn for youEntry = orange line, SL = stop loss, TP1 = 1× your risk, TP2 = 2× your risk. Always set the stop.
- Follow the trade tableINTEL PRO · TRADE (top right) shows the Status: Active, TP1 hit — running, TP2 hit or Stopped out. The stop is not moved for you.
Reading a signal
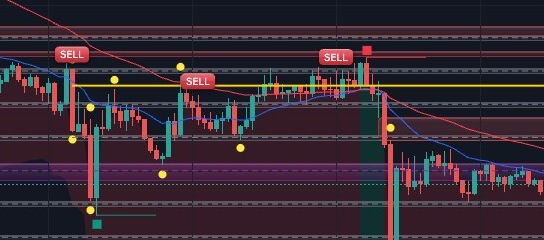
SELL signals on Gold 15m, 23 Oct. The INTEL PRO · TRADE table (top right of your chart) lists the latest plan: entry, stop loss, TP1 and TP2.
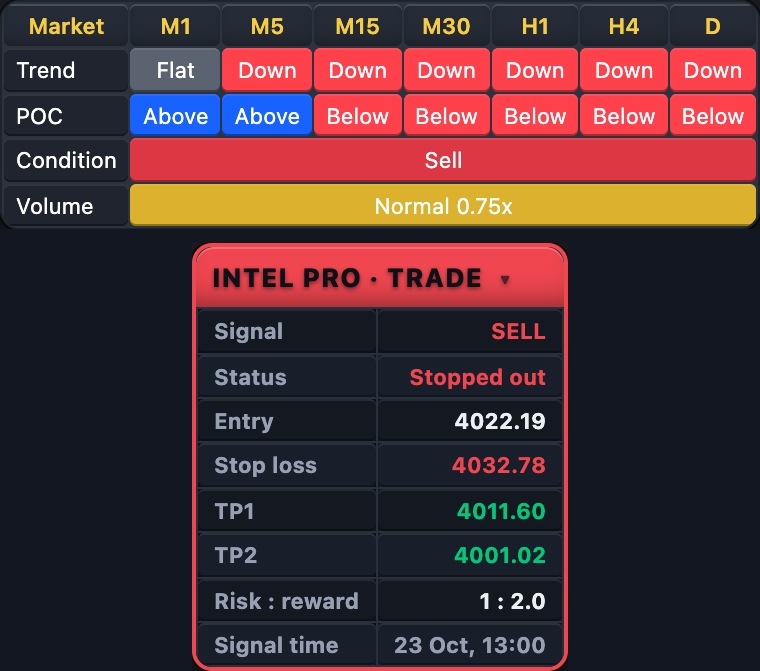
The market dashboard
- Trend row: Up (blue), Down (red) or Flat (grey) for each timeframe, from its 20 and 50 lines.
- POC row: is price Above or Below the busiest price (POC = most-traded price) of the last 80 candles there?
- Condition: Buy when price is above this chart’s POC, red Sell when below. The short thick yellow line is that POC.
- Volume: High (1.5× average or more), Normal, or Low (under 0.7×). “(est.)” means volume was estimated.
- n/a means that timeframe’s candles are not loaded yet.
Golden rules
- Learning? Only act on BUY / SELL labels. Treat zones and FVG boxes as a map, not signals.
- Never skip the stop loss. Risk 1% of your account or less per trade.
- Skip big news times (rate decisions, NFP).
- Practise first with the Replay button: play old candles forward and trade them for free.
🔔 Get told when it fires: click Alerts, choose BTM – Intel PRO and tick “Confirmed Buy Signal” and “Confirmed Sell Signal”.
For educational purposes only. The results in this guide come from testing on past prices. Past performance does not guarantee future results, and real spreads, slippage and delays can make results worse. Nothing here is financial advice, and trading carries a high risk of losing money. Read the risk warning.