



INDICATOR · BEGINNER GUIDE
ANCHORED VWAP
Draws the average price paid since a start point, with bands that show when price is fair or stretched.
◆Restarts each day on 15m◆Bands at 1σ and 2σ◆Swing-high and swing-low VWAPs◆Plain-English panel
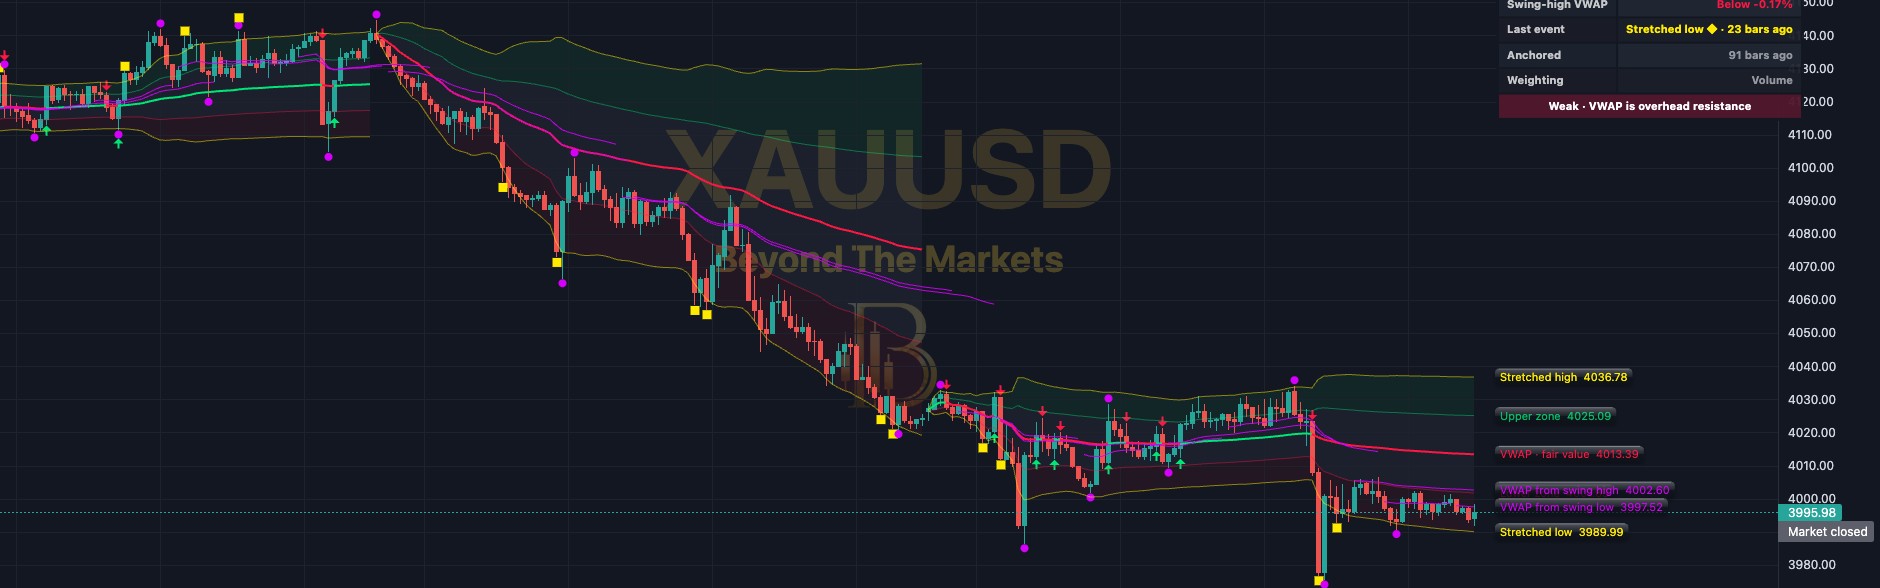 WHAT YOU SEE · GOLD 15m
123456
1VWAP line: the average price paid since the start (today, on a 15m chart). Green = price above, red = below.
2Fair-value zone: the grey band around VWAP, 1σ each side (σ = normal spread). Price is “fair” in here.
3Outer bands (yellow): 2σ away. A close out here means price is stretched.
4Purple swing VWAPs: VWAPs started from the last swing high and swing low. Extra levels to watch.
5Arrows and squares: green up arrow = closed back above VWAP, red down arrow = closed back below, yellow square = stretched.
6Labels on the right: each level named with its price, e.g. “VWAP · fair value”.
Use it in 5 steps
- Switch it onOpen Charts → Basic Indicators → tick Anchored VWAP. On Auto it restarts each day on 15m charts, each week up to 4H.
- See who is in controlPrice above the green VWAP = buyers in control. Below the red VWAP = sellers. The panel’s In control row says it in words.
- Look for pullbacks to valueAbove VWAP, dips into the fair-value zone may find support. Below VWAP, rallies may meet selling. Wait for price to react, not just touch.
- Do not chase a stretchA yellow square means a close beyond the outer band. The panel warns “Extended · chasing longs is risky” (or shorts).
- Watch reclaims and lossesA green arrow = price closed back above VWAP, a red arrow = closed back below. Keep your stop beyond the level, not on it.
Reading a reclaim
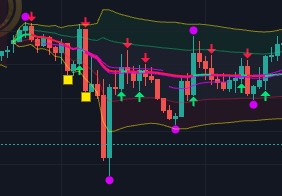
Gold 15m, 23 Oct. Price dipped under the VWAP, then candles closed back above it: the small green arrows mark each reclaim and the line turns green.
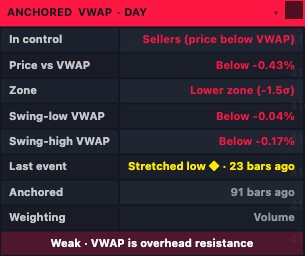
The panel
- In control: Buyers (price above VWAP) or Sellers (price below VWAP). The title bar takes the same colour.
- Zone: Fair-value, Upper or Lower zone, or Stretched high / low, with how many σ price is from VWAP.
- Swing-low / Swing-high VWAP: is price above or below each purple line, and by how many %.
- Last event: the last reclaim, loss or stretch, and how many bars ago. Weighting says Volume or Time.
- Bottom line: a plain tip, e.g. “Above VWAP · dips may find support”. Click the title bar to hide it.
Golden rules
- VWAP is a level, not a signal. Use it with the trend and a clear reaction.
- Never skip the stop loss. Risk 1% of your account or less per trade.
- Wait for the close. Arrows appear on closed candles only; a live candle can still slip back.
- Practise first with the Replay button: play old candles forward and trade them for free.
🔔 Get told when it happens: click Alerts (the bell), choose Anchored VWAP and tick “Reclaimed VWAP (closed back above)” and “Lost VWAP (closed back below)”.
For educational purposes only. The results in this guide come from testing on past prices. Past performance does not guarantee future results, and real spreads, slippage and delays can make results worse. Nothing here is financial advice, and trading carries a high risk of losing money. Read the risk warning.