



INDICATOR · BEGINNER GUIDE
ATR
Shows how far price moves in a typical candle right now. Use it to set a stop loss that fits today’s market.
◆Average of last 14 candles◆In price, pips or %◆Shows size, not direction◆Sizes your stop loss
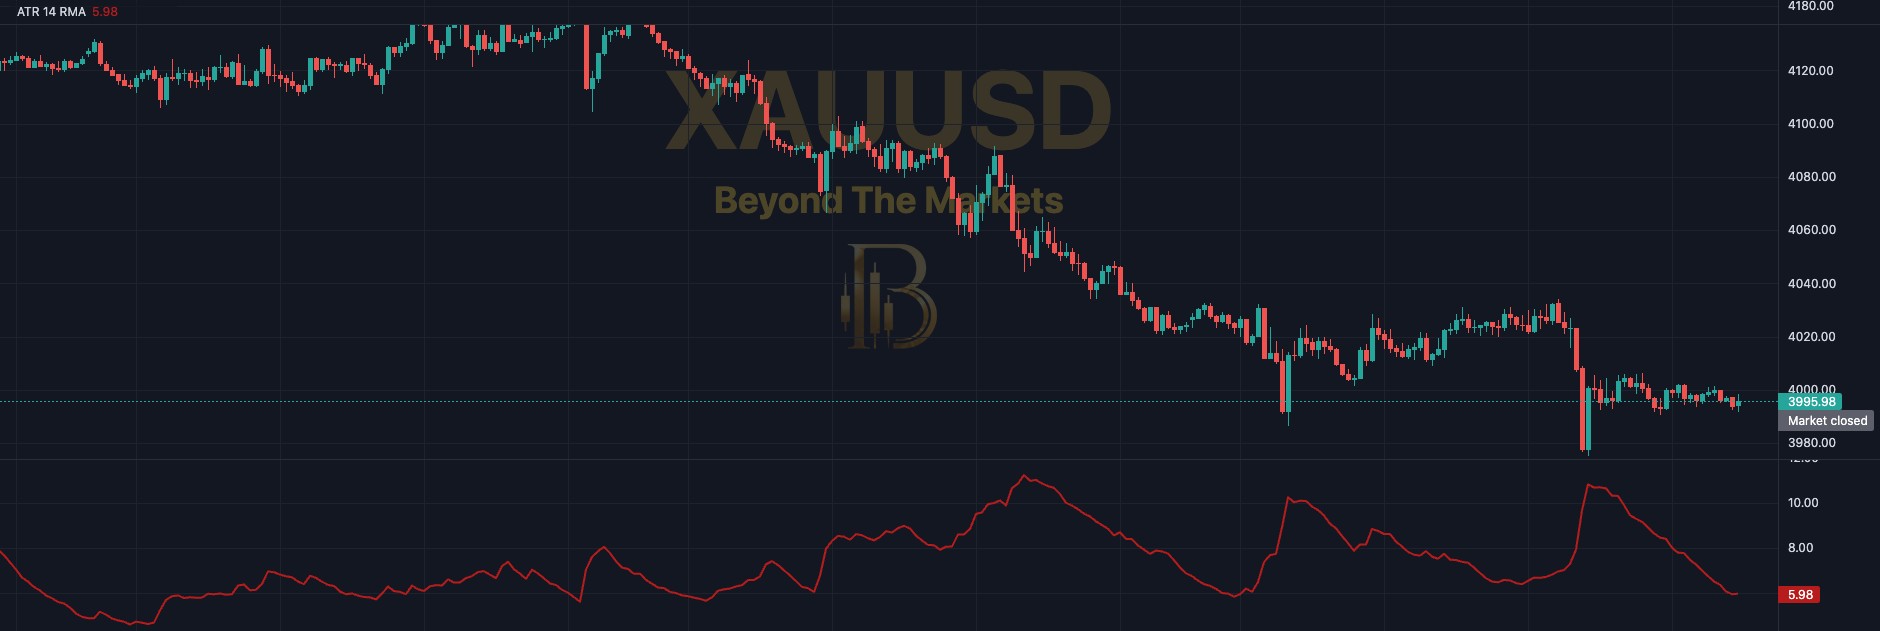 WHAT YOU SEE · GOLD 15m · PRICE + ATR PANE
123456
1Dark red line: the ATR 14. How big the candles have been lately, gaps included.
2Name and value: top left reads ATR 14 RMA; the tag on the right is the latest ATR, in price units.
3Rising line: candles are getting bigger. The market is speeding up.
4Falling line: candles are getting smaller. The market is going quiet.
5Sudden spike: one or two huge candles, often news. ATR jumps, then eases back slowly.
6No direction: ATR rises in sharp falls too. It measures size, never up or down.
Use it in 5 steps
- Switch it onOpen Charts → Basic Indicators (ƒx) → tick Average True Range (ATR). A dark red line appears in its own pane under the chart.
- Read the ATRHover over your entry candle, or read the tag on the right. That number is roughly one candle’s normal move right now.
- Size your stop with itMultiply ATR by a number you choose, for example 1.5, and place the stop that far from entry. Quiet market, tighter stop. Wild market, wider stop.
- Then size the tradeA wider stop means a smaller position. Keep the money at risk to 1% of your account or less, whatever the stop distance.
- Switch to pipsClick ⚙ and set Show in to Pips to read stop distances straight off the pane. One pip on gold = 0.1.
ATR for your stop
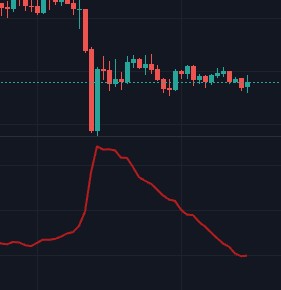
Gold 15m, 23 Oct. One huge candle lifted ATR from about 7 to nearly 11. A 1.5 × ATR stop grew from about 10 to 16 points, then shrank again as things calmed down.
⚙ Average True Range (ATR)
ATR
Length14
SmoothingRMA
Show inPrice
Average line
Show average of the ATROff
Average length50
Alert level (0 = off)0
Colours
ATR#B71C1C
Average line#787B86
Settings worth knowing
- Show in: Price, Pips or % of price. Pips = 10 × the smallest price step (0.0001 EURUSD, 0.01 USDJPY, 0.1 gold).
- Show average of the ATR (off): a grey 50-candle average. ATR above it = speeding up, below = calming down.
- Alert level (0 = off): type a value to be told when ATR rises above it.
- Length 14 and Smoothing RMA (Wilder’s method) are the classic defaults. Leave them while learning.
Golden rules
- ATR is not a signal. It never says buy or sell, only how big the moves are.
- Never skip the stop loss. Risk 1% of your account or less per trade.
- Re-check it before every trade. ATR changes through the day and can jump after news.
- Practise first with the Replay button: play old candles forward and trade them for free.
🔔 Get told when it fires: click Alerts, choose Average True Range (ATR) and tick “ATR rises above its average (volatility expanding)”.
For educational purposes only. The results in this guide come from testing on past prices. Past performance does not guarantee future results, and real spreads, slippage and delays can make results worse. Nothing here is financial advice, and trading carries a high risk of losing money. Read the risk warning.