



AI SCANNER · BEGINNER GUIDE
BTM BREAKOUT
Waits for a pullback in a trend, then draws a buy or sell stop order with its stop loss and target.
◆Bollinger Bands + BTM pressure◆Pending stop orders drawn◆Target = 3 × risk◆Orders cancel after 20 candles
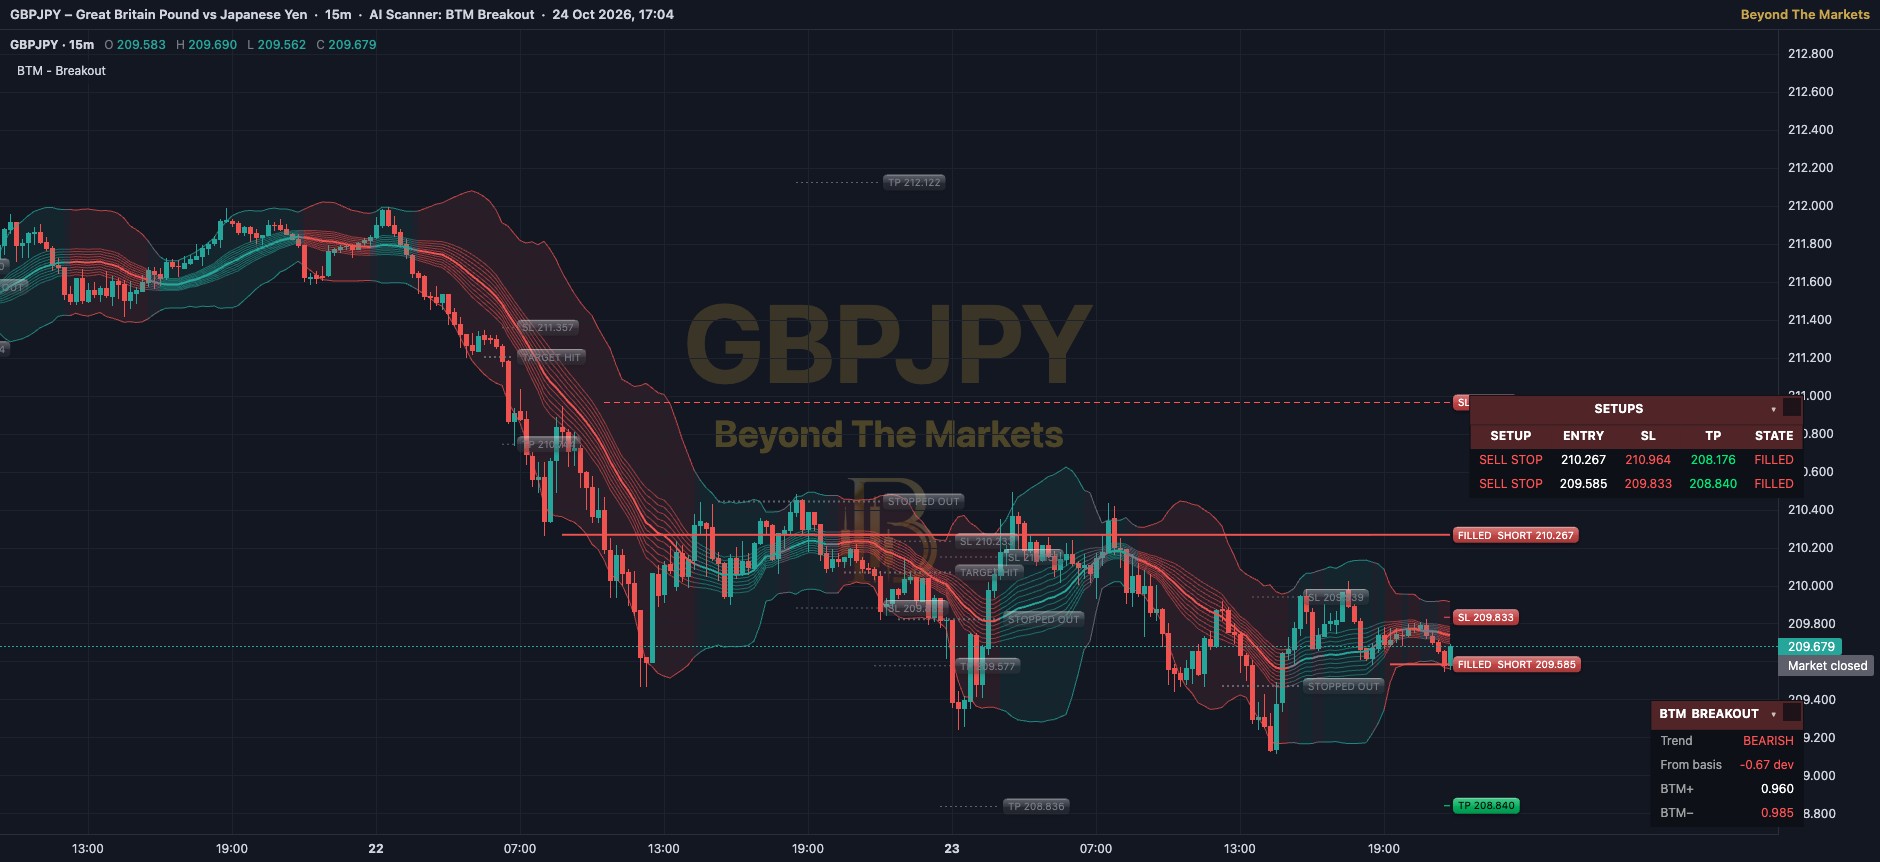 WHAT YOU SEE · GBPJPY 15m
123456
1Middle line: the 20-candle average. Green = uptrend, red = downtrend, grey = no trend.
2Ladder bands: five thin lines each side of the middle line, in the same trend colour. They show how far price has pushed.
3Outer bands and shading: the Bollinger Bands. The light wash between them is the trend colour too.
4Candle colours: green = the candle closed up, red = it closed down.
5BUY STOP / SELL STOP line: an order waiting above a swing high (buy) or below a swing low (sell). Not a trade yet.
6Trade lines: solid = FILLED trade, red dashed = stop loss, bright green dashed = target. Grey dotted = finished.
Use it in 5 steps
- Switch it onOpen Charts → AI Scanners → tick BTM – Breakout. The bands turn green in an uptrend, red in a downtrend, grey with no trend.
- Check the trendAn uptrend needs 3 of the last 5 candles above the middle line and BTM+ above BTM−. The readings panel then says BULLISH.
- Spot the stop orderAfter a pullback, a dashed BUY STOP line appears above the last swing high. It cancels after 20 candles or if the trend flips.
- Wait for the fillA candle must close above the line. It turns solid: FILLED LONG, with a red SL and green TP 3 times the risk away.
- Let it finishEach trade runs until it touches its stop or its target, then turns grey: STOPPED OUT or TARGET HIT. Sells work the same way, upside down.
Reading a setup
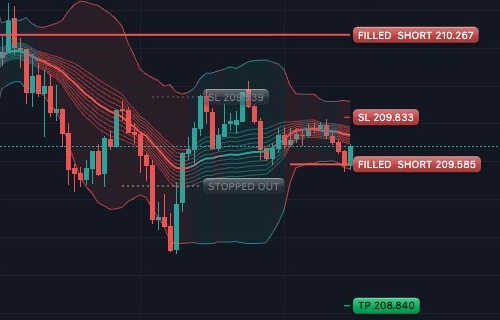
SELL STOP filled on GBPJPY 15m, 23 Oct. Short from 209.585, with its stop (209.833) and target (208.840) drawn for you.
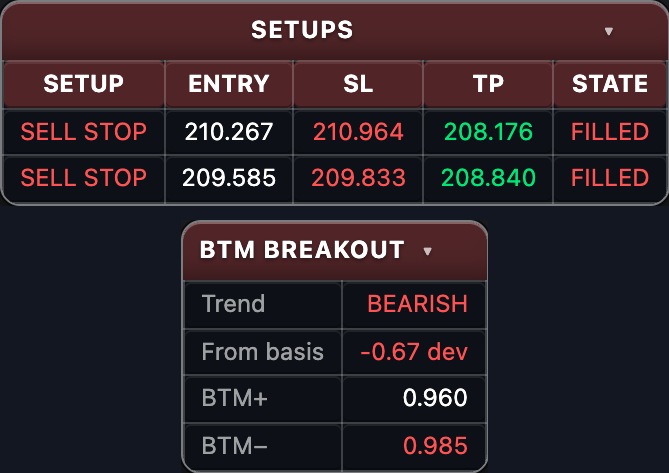
The setups table
- Each row is one order or trade: BUY STOP in green, SELL STOP in red, with its ENTRY, SL and TP prices.
- STATE: WAITING = the order is not filled yet. FILLED = the trade is live.
- “no setups” means nothing is waiting or open. Be patient.
- BTM BREAKOUT panel (bottom right): Trend says BULLISH, BEARISH or no trend. BTM+ and BTM− show buying and selling pressure.
- Title bars take the trend colour. Click one to hide or show the panel, or drag it anywhere.
Golden rules
- Learning? Only act once an order is FILLED on a closed candle, never on the dashed line alone.
- Never skip the stop loss. Risk 1% of your account or less per trade.
- Up to 10 trades can overlap. Add up the risk of every open trade, not just the newest.
- Practise first with the Replay button: play old candles forward and trade them for free.
🔔 Get told when it fires: click Alerts, choose BTM – Breakout and tick “Buy stop filled (LONG)” and “Sell stop filled (SHORT)”.
For educational purposes only. The results in this guide come from testing on past prices. Past performance does not guarantee future results, and real spreads, slippage and delays can make results worse. Nothing here is financial advice, and trading carries a high risk of losing money. Read the risk warning.