



CHART AI
Press ✨ Explain and the AI reads your chart in plain English: the big picture, what is happening now and what is worth watching. Press Explain again any time for a fresh reading.
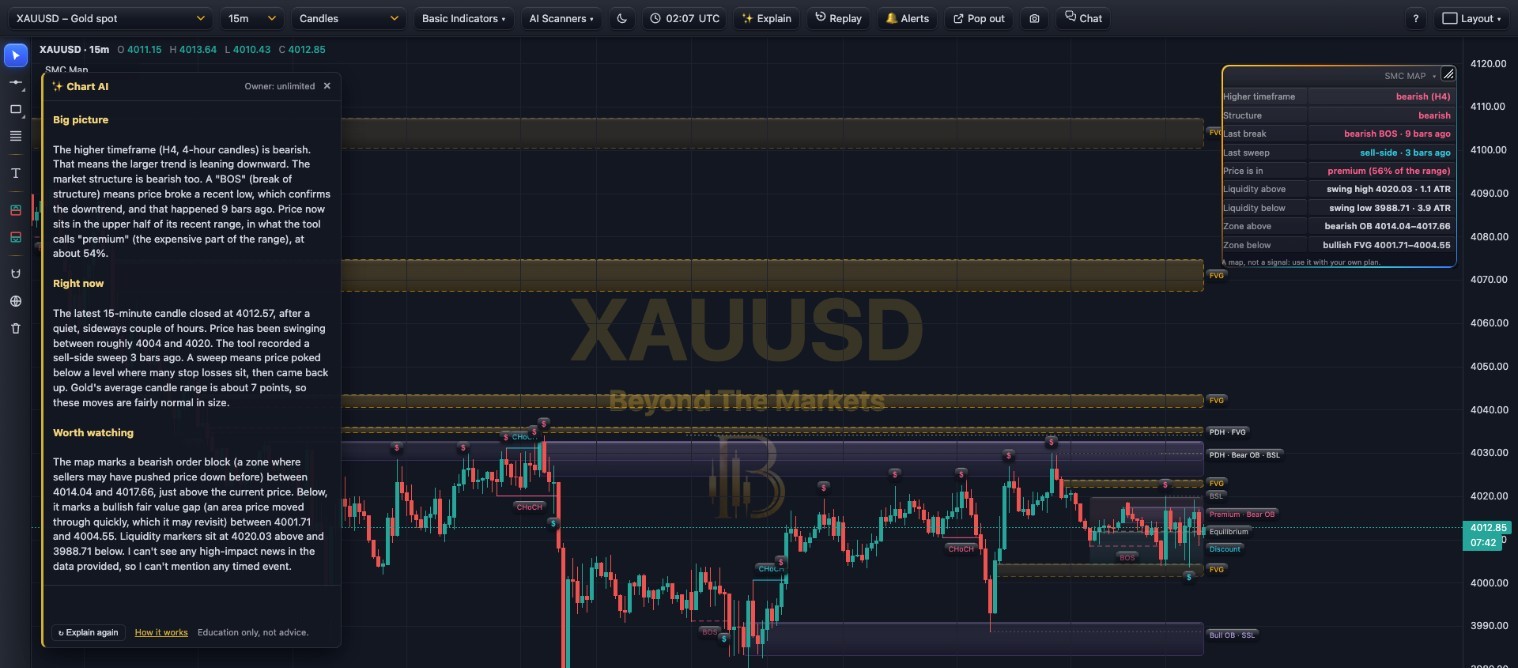 WHAT YOU SEE · GOLD 15m WITH SMC MAP
123456
Use it in 5 steps
- Set up your chartPick a market and timeframe and add the tools you use, e.g. SMC Map or an AI scanner. The AI only reads what is on the chart.
- Press ✨ ExplainOn the chart’s toolbar. A reading appears in a few seconds.
- Read the three partsBig picture first, then Right now, then Worth watching.
- Look up what you don’t understandNew trading words are explained in the reading. For more, see the Education glossary or that tool’s guide.
- Decide for yourselfChart AI never says buy or sell. Use your scanner’s rules and your own plan.
🤖 Notes on AI scanner alerts
When an AI scanner alert fires, one extra line of context is added: the trend, how volatile the market is, the AI Optimiser’s call and any red-folder news coming up. It appears in the pop-up, the 🔔 Alerts list and on Telegram. Alert notes are free: they don’t count towards your 10 a day.
Good ways to use it
- Explain the 4-hour chart first, then your trading timeframe.
- Add a scanner, then Explain to read its panel in plain words.
- Explain again after a big candle or news to see what changed.
- Compare its reading with your own before you trade.
- Look up new words in the glossary.
Good to know
- 10 explanations a day per member.
- A reply that fails is not counted.
- It can only see this chart: add tools for a richer reading.
- It does not see your account, trades or drawings.
Golden rules
- Education, not advice. The AI explains; you decide.
- It can be wrong. Check what it says against the chart.
- Risk 1% or less per trade and always use a stop loss.
For educational purposes only. The results in this guide come from testing on past prices. Past performance does not guarantee future results, and real spreads, slippage and delays can make results worse. Nothing here is financial advice, and trading carries a high risk of losing money. Read the risk warning.