



INDICATOR · BEGINNER GUIDE
CORRELATION TABLE
Which markets move with yours, and which move against it.
◆+1 to −1◆Strong · Moderate · Weak◆17, 28 or 40 markets◆Risk check
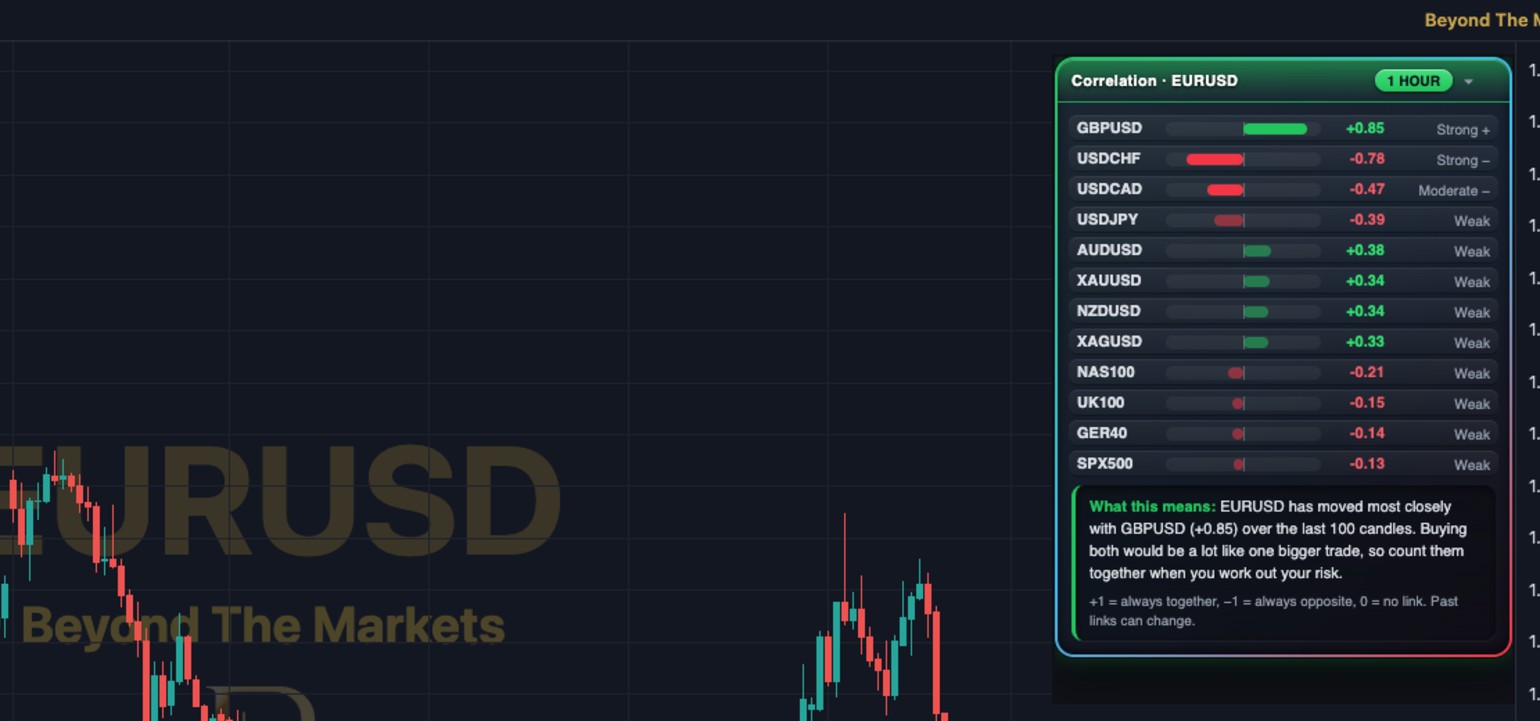 WHAT YOU SEE · EURUSD 1H · 2 NOV
123456
1Title: your market and the timeframe.
2Green bar: moves with your market.
3Red bar: moves against it.
4Label: Strong, Moderate or Weak.
5Weak rows: little link lately.
6What this means: the risk in plain words.
Use it in 5 steps
- Switch it onCharts → Basic Indicators (ƒx) → tick Correlation Table.
- Read the number+1 = always together, −1 = always opposite, 0 = no link.
- Check before a tradeAlready in a trade? See if the new one is strongly linked to it.
- Count risk togetherTwo strong + trades in the same direction act like one bigger trade.
- Recheck oftenLinks change over time, so check again each week.
Gold and silver moving together
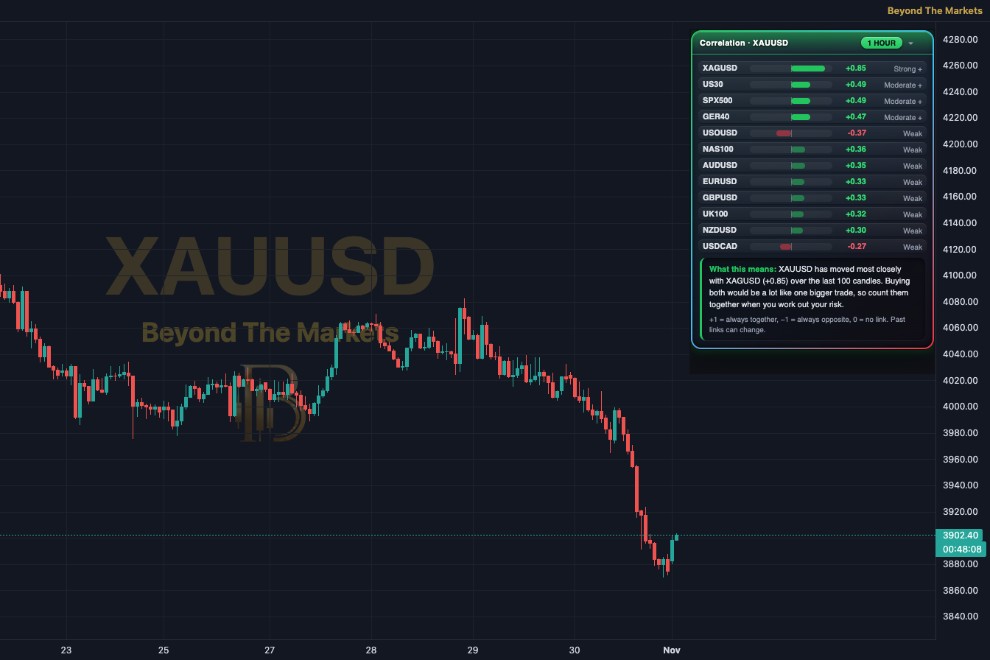
XAUUSD 1H, 2 Nov. Silver (XAGUSD) has moved most closely with gold: +0.85, Strong. A buy on both is close to one bigger trade.
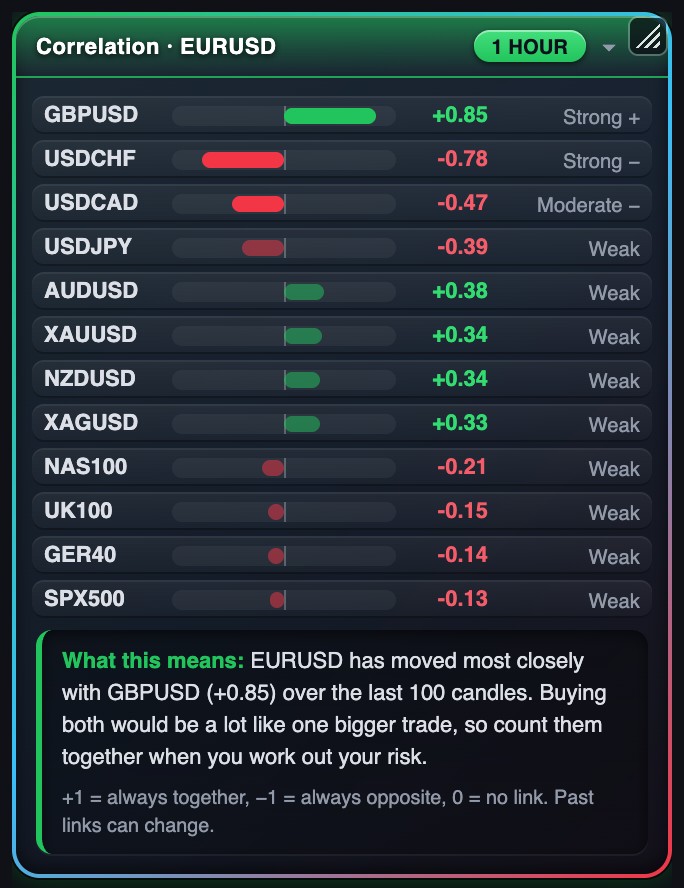
The dashboard
- Each row: one market and its number from +1 to −1.
- Bar: green to the right = with, red to the left = against.
- Label: Strong (0.7+), Moderate (0.4+) or Weak.
- Sorted: the strongest links are at the top.
- What this means: the closest match and what it means for risk.
Golden rules
- Past links can change. A strong number today is not a promise.
- Based on the last 100 candles on the timeframe you pick.
- Use it for risk, not to pick a direction.
- Always use a stop loss and risk 1% or less per trade.
🔔 Before a second trade: open this table and check the new market is not strongly linked to one you already hold.
For educational purposes only. The results in this guide come from testing on past prices. Past performance does not guarantee future results, and real spreads, slippage and delays can make results worse. Nothing here is financial advice, and trading carries a high risk of losing money. Read the risk warning.