



INDICATOR · BEGINNER GUIDE
DIVERGENCE FINDER
Spots when price and momentum disagree: an early warning that a move is running out of steam, drawn on the chart and on RSI.
◆RSI or MACD◆Graded Strong / Medium / Weak◆Drawn on price and RSI◆Honest results count
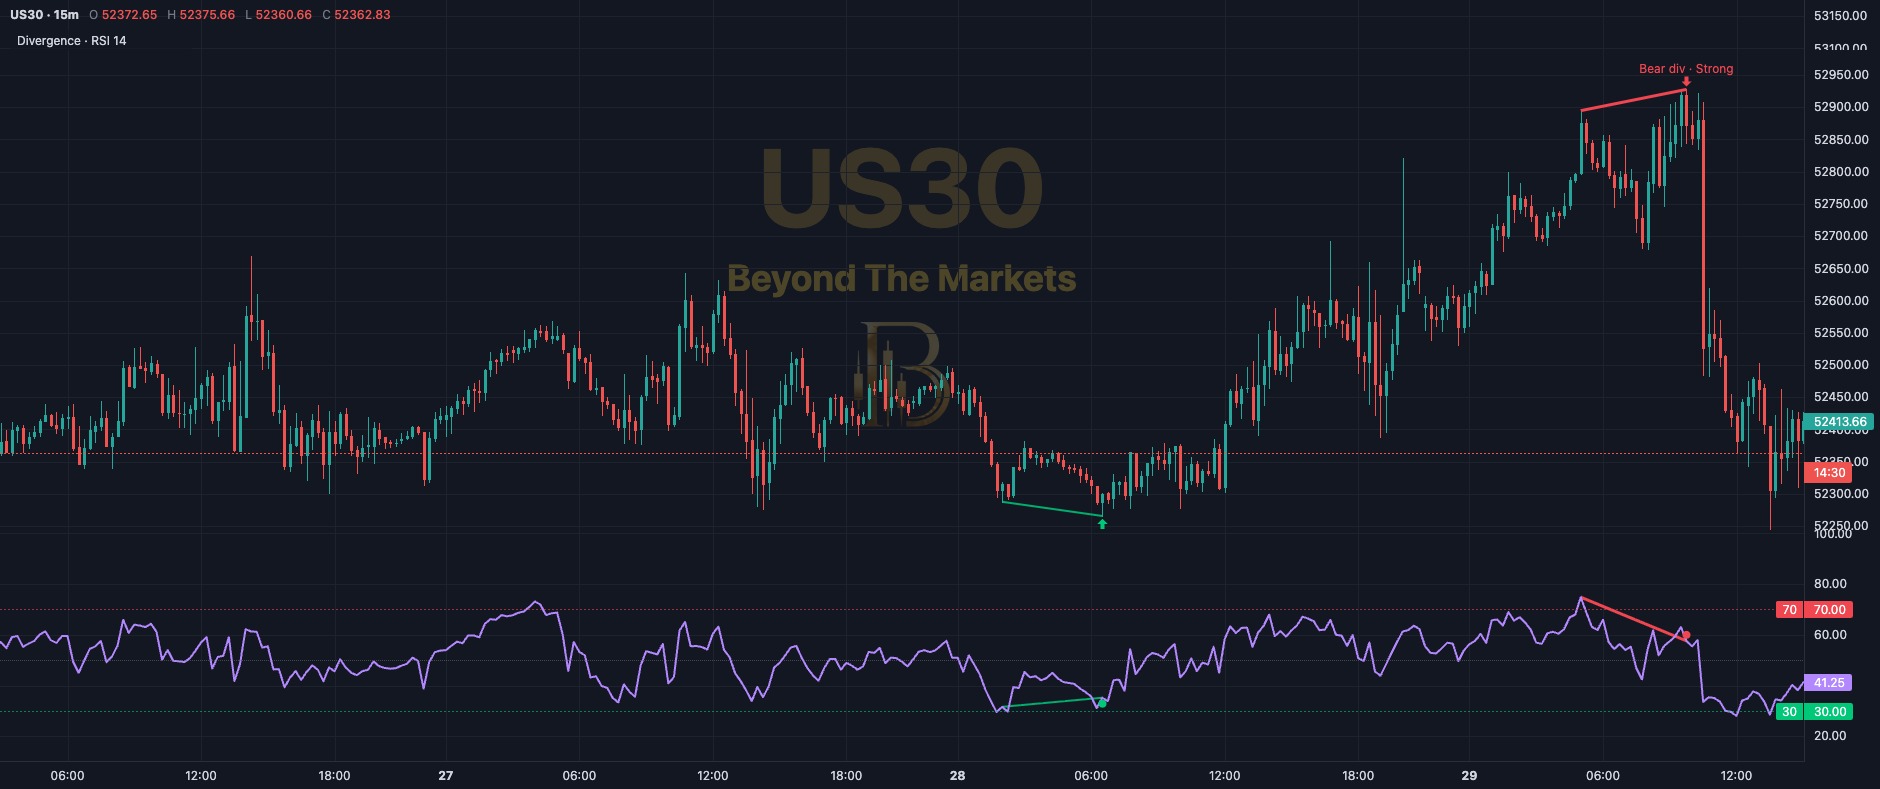 WHAT YOU SEE · US30 15m · 29 OCT
123456
1Bearish divergence: a red line joins two highs. The second high is higher.
2The label: the type and its strength: Strong ●●●, Medium ●●○ or Weak ●○○.
3Same highs on RSI: the matching line slopes the other way: less push behind the rise.
4Bullish divergence: a green line joins two lows: price lower, RSI higher.
5RSI panel: momentum from 0 to 100. Near the 70 / 30 lines grades stronger.
6What came next: after this Strong bearish divergence, US30 kept falling.
Use it in 5 steps
- Switch it onOpen Charts → Basic Indicators (ƒx) → tick Divergence Finder. An RSI panel opens under the chart.
- Look at the move firstDivergence warns that a move is tiring. It matters most after a long run, at support or resistance.
- Wait for the labelA swing only counts once it is finished (3 candles later). A dotted Possible line isn’t confirmed.
- Wait for price to turnNever act on divergence alone. For a buy, wait for a bullish candle or a break of a small high.
- Stop beyond the swingPut your stop beyond the swing that made the divergence. If price breaks it, the idea is wrong.
A bullish divergence
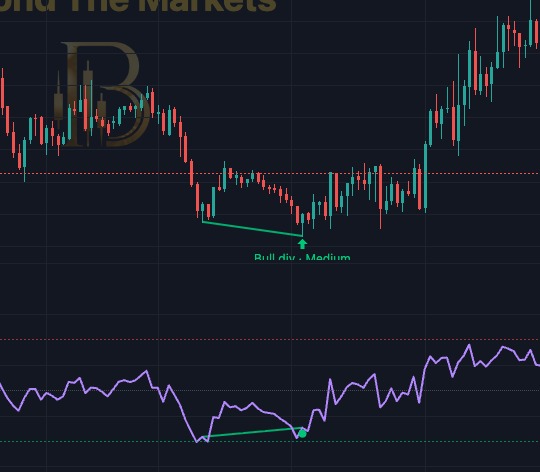
US30 15m, 28 Oct. Price made a lower low, RSI a higher low. Confirmed at 07:15 UTC near 52,319; the Dow reached 52,928 the next morning.
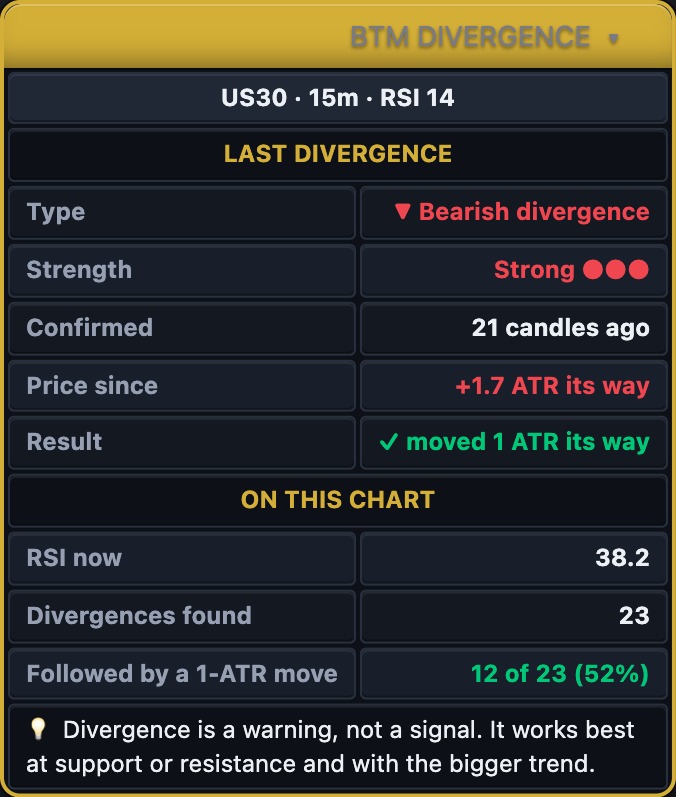
The dashboard
- Last divergence: its type, strength and how many candles ago it was confirmed.
- Price since: how far price has moved since, in ATRs (the size of a normal candle).
- Result: ✓ if price moved 1 ATR its way before 1 ATR against, within 10 candles.
- Followed by a 1-ATR move counts that for every divergence on the chart. About half is normal: a warning, not a promise.
- The 💡 tip says in plain words what to do next.
Golden rules
- A warning, not a signal. Divergence can last a long time in a strong trend.
- Use it at a level. It works best at support, resistance or an ADR line.
- Always use a stop loss and risk 1% of your account or less per trade.
- Practise first with the Replay button: trade old candles for free.
🔔 Get told when it fires: click Alerts, choose Divergence Finder and tick “Bullish divergence confirmed” or “Bearish divergence confirmed”.
For educational purposes only. The results in this guide come from testing on past prices. Past performance does not guarantee future results, and real spreads, slippage and delays can make results worse. Nothing here is financial advice, and trading carries a high risk of losing money. Read the risk warning.