



INDICATOR · BEGINNER GUIDE
EMA MOVING AVERAGE
A blue average of the last 50 candles that gives recent candles more weight, so it turns sooner than a simple average.
◆Average of last 50 closes◆Newest candles count most◆One blue line on price◆Alerts when price crosses
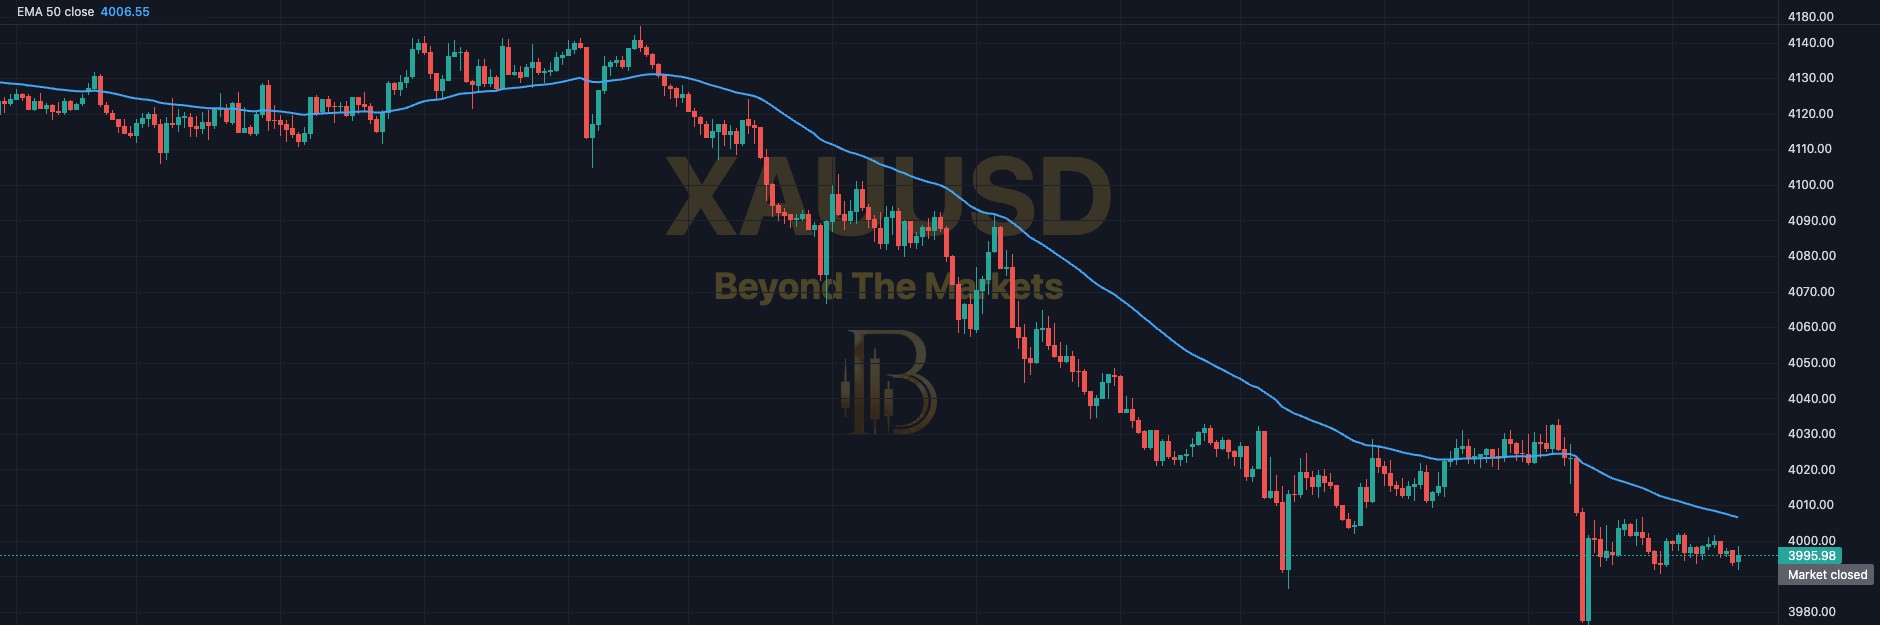 WHAT YOU SEE · GOLD 15m · EMA 50
123456
1Blue line: the EMA 50. A smooth average of 50 closes that leans on the newest ones.
2Name tag: top left reads EMA 50 close: the length, then the price it averages.
3Price above a rising line: uptrend. Buyers have the upper hand.
4Price below a falling line: downtrend. Sellers have the upper hand.
5Pullback to the line: in a trend, price may dip back to the EMA. Watch whether it bounces or breaks.
6A cross: a candle closes on the other side of the line. This is what the alerts watch for.
Use it in 5 steps
- Switch it onOpen Charts → Basic Indicators (ƒx) → tick Moving Average (EMA). A blue line appears on the price chart.
- Trade with its slopeEMA rising with price above: only look for buys. Falling with price below: only sells. That one rule keeps you with the trend.
- Wait for the pullbackLet price come back to the blue line. Act only when a candle closes back away from it, in the trend direction.
- Stop beyond the swingPlace your stop loss past the pullback’s low (for a buy) or high (for a sell), not exactly on the EMA.
- Why EMA, not SMA?An SMA treats every candle the same. The EMA weights the newest most, so it reacts faster to a turn, but also jumps more on sudden spikes.
A pullback to the EMA
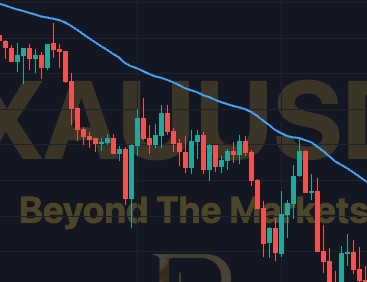
Gold 15m, 22 Oct. In the downtrend, price bounced back up to the falling blue EMA 50, touched it, then turned lower again.
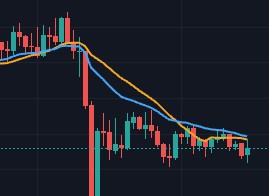
EMA vs SMA, same length
- Blue EMA and orange SMA, both set to 20 candles for this picture.
- SMA: every one of the 20 closes counts the same.
- EMA: the newest close counts most, and older ones fade away gradually.
- At a turn the EMA bends first. The SMA follows a little later.
- Faster is not always better: the EMA also reacts more to one-off spikes.
Golden rules
- 50 candles by default. A slower, bigger-picture line than the SMA’s 20. Use it as your trend filter.
- Trend first. Don’t buy below a falling EMA or sell above a rising one.
- Never skip the stop loss. Risk 1% of your account or less per trade.
- Practise first with the Replay button: play old candles forward and trade them for free.
🔔 Get told when it fires: click Alerts, choose Moving Average (EMA) and tick “Price crosses above the EMA” or “Price crosses below the EMA”.
For educational purposes only. The results in this guide come from testing on past prices. Past performance does not guarantee future results, and real spreads, slippage and delays can make results worse. Nothing here is financial advice, and trading carries a high risk of losing money. Read the risk warning.