



AI SCANNER · BEGINNER GUIDE
BTM MARKET SCANNER
Ranks 12 markets from strongest to weakest and shows the busiest hours to trade the market on your chart.
◆Ranks up to 12 markets◆Measured on 1-hour candles◆Best-time-to-trade map◆A shortlist, not signals
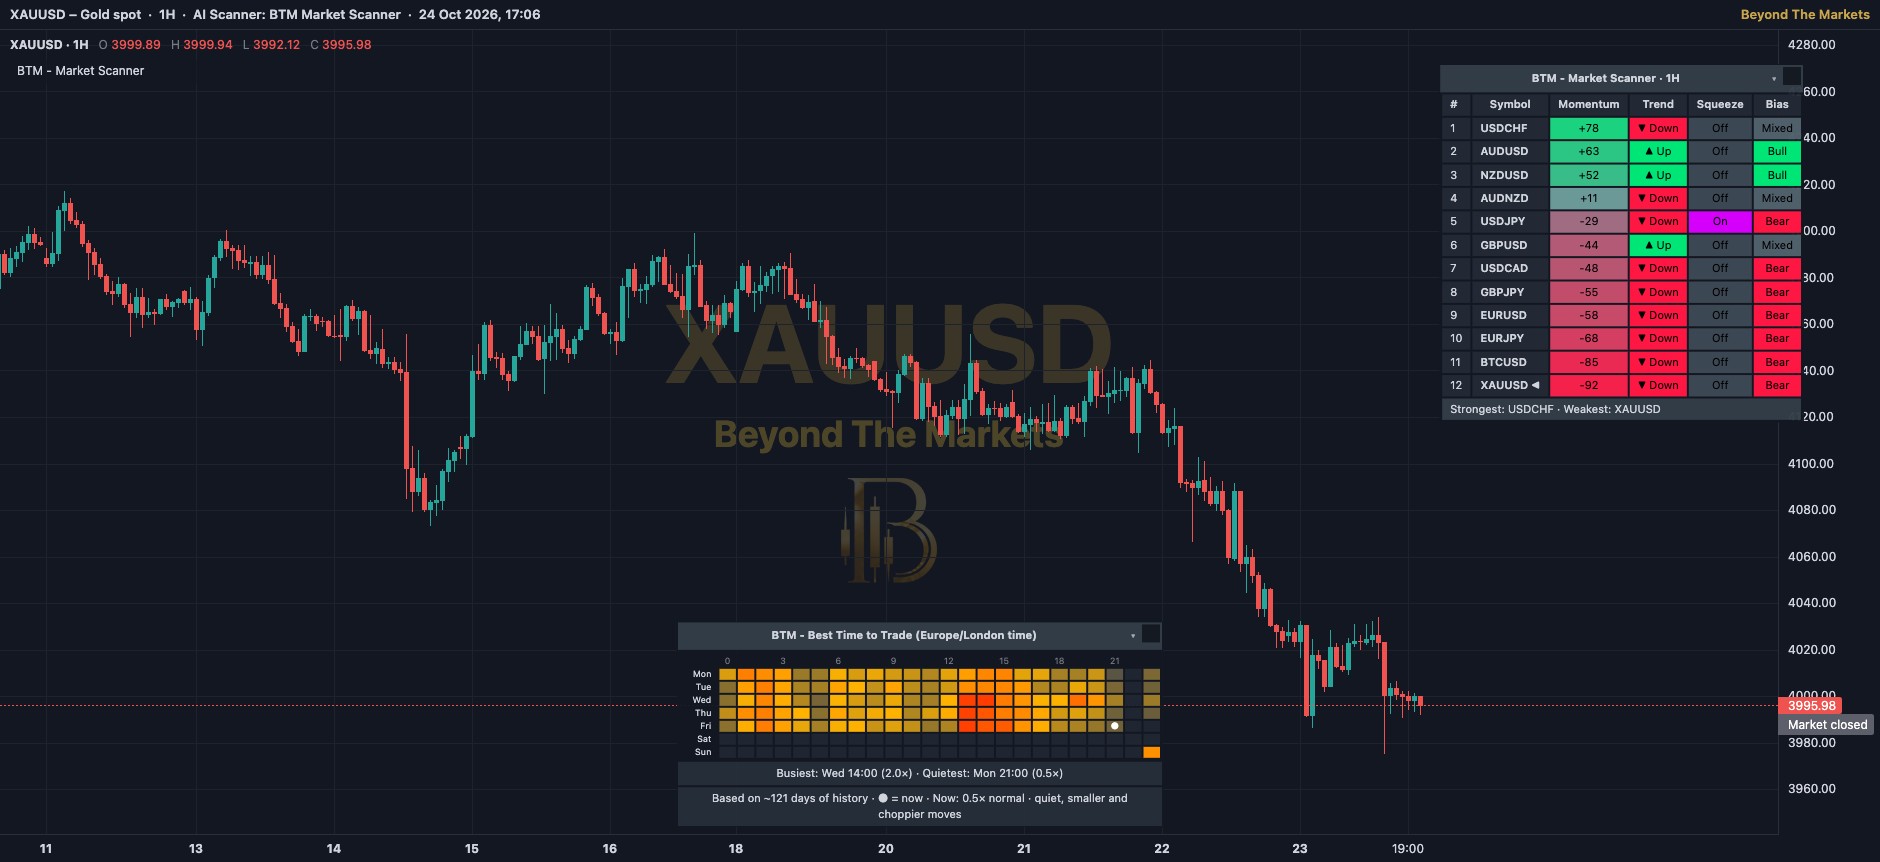 WHAT YOU SEE · GOLD 1H
12345
1The ranking: markets listed from strongest (top) to weakest (bottom). ◀ marks the market on your chart.
2Momentum: how hard price is pushing. + green = up, − red = down, yellow ⚠ = overstretched.
3Trend: is price above or below its long-term average (the 200 EMA)? ▲ Up or ▼ Down.
4Squeeze: price boxed into a tight range. Deep = very tight, On = tight, Off = normal.
5Bias: the quick answer. Bull = trend and momentum both up, Bear = both down, Mixed = they disagree.
6Best time to trade: a day-by-hour map of how much this market usually moves. Hot = busy, dark blue = quiet.
Use it in 5 steps
- Switch it onOpen Charts → AI Scanners → tick BTM – Market Scanner. Use a 1-hour chart or lower so the time map shows.
- Read the top and bottomThe top rows are pushing up hardest, the bottom rows down hardest. The footer names the Strongest and Weakest.
- Look for agreementShortlist markets with Bull or Bear in Bias. Mixed means trend and momentum disagree, so skip it for now.
- Don’t chase ⚠A yellow ⚠ means the move is already stretched. Wait for a calmer moment rather than jumping in late.
- Pick your hourOpen the shortlisted market and check the time map. Busy hours bring bigger moves. Plan your own entry and stop loss.
Best time to trade
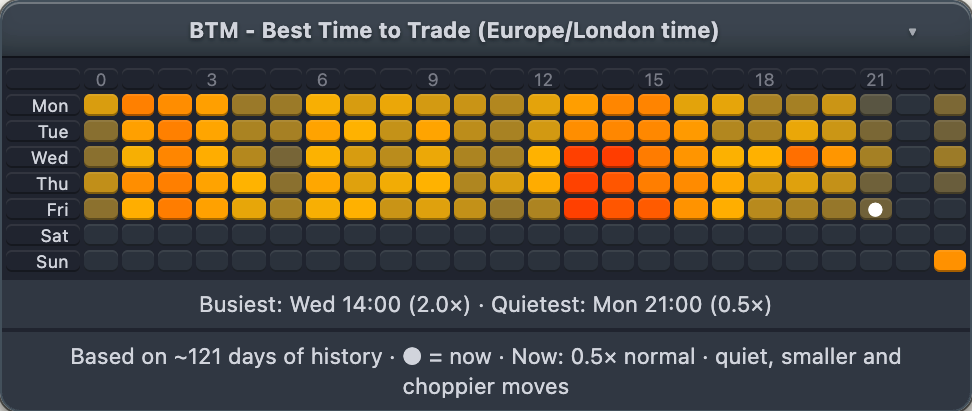
Brighter orange = busier hours (London time). Grey = quiet or not enough data. The white dot ● shows where you are now.
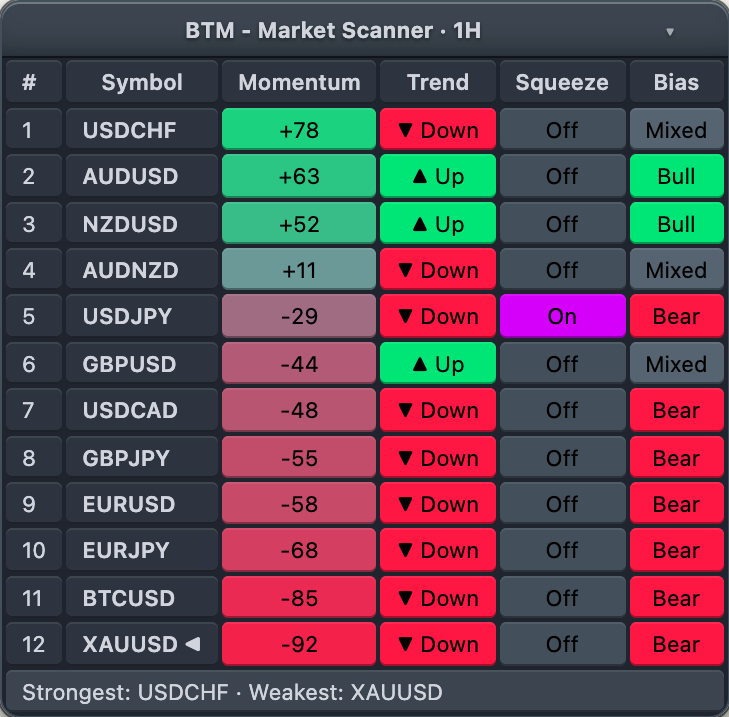
The scanner table
- # is the rank. Rows are sorted by Momentum, strongest push up first.
- Momentum beyond ±150 turns yellow with ⚠: price has run a long way, fast.
- Trend compares the last closed 1-hour candle with its 200 EMA (a long-term average).
- Bias is Bull or Bear only when Trend and Momentum point the same way.
- Click the title bar to hide or show it. Drag it anywhere; ↺ puts it back.
Golden rules
- Learning? Only look at markets showing Bull or Bear. Leave Mixed alone.
- It is a shortlist, not a signal. Always set your own stop loss and risk 1% of your account or less.
- Skip big news times (rate decisions, NFP), even in a busy hour.
- Practise first with the Replay button: play old candles forward and trade them for free.
🔔 Alerts: this scanner has no alerts. Check the table again each time a new 1-hour candle closes.
For educational purposes only. The results in this guide come from testing on past prices. Past performance does not guarantee future results, and real spreads, slippage and delays can make results worse. Nothing here is financial advice, and trading carries a high risk of losing money. Read the risk warning.