



INDICATOR · BEGINNER GUIDE
PIVOT POINTS
Works out yesterday’s pivot plus three resistance and three support levels: prices to watch for bounces and breaks today.
◆Daily pivots by default◆Pivot, R1–R3, S1–S3◆Previous 5 days, faded◆Alerts on candle-close crosses
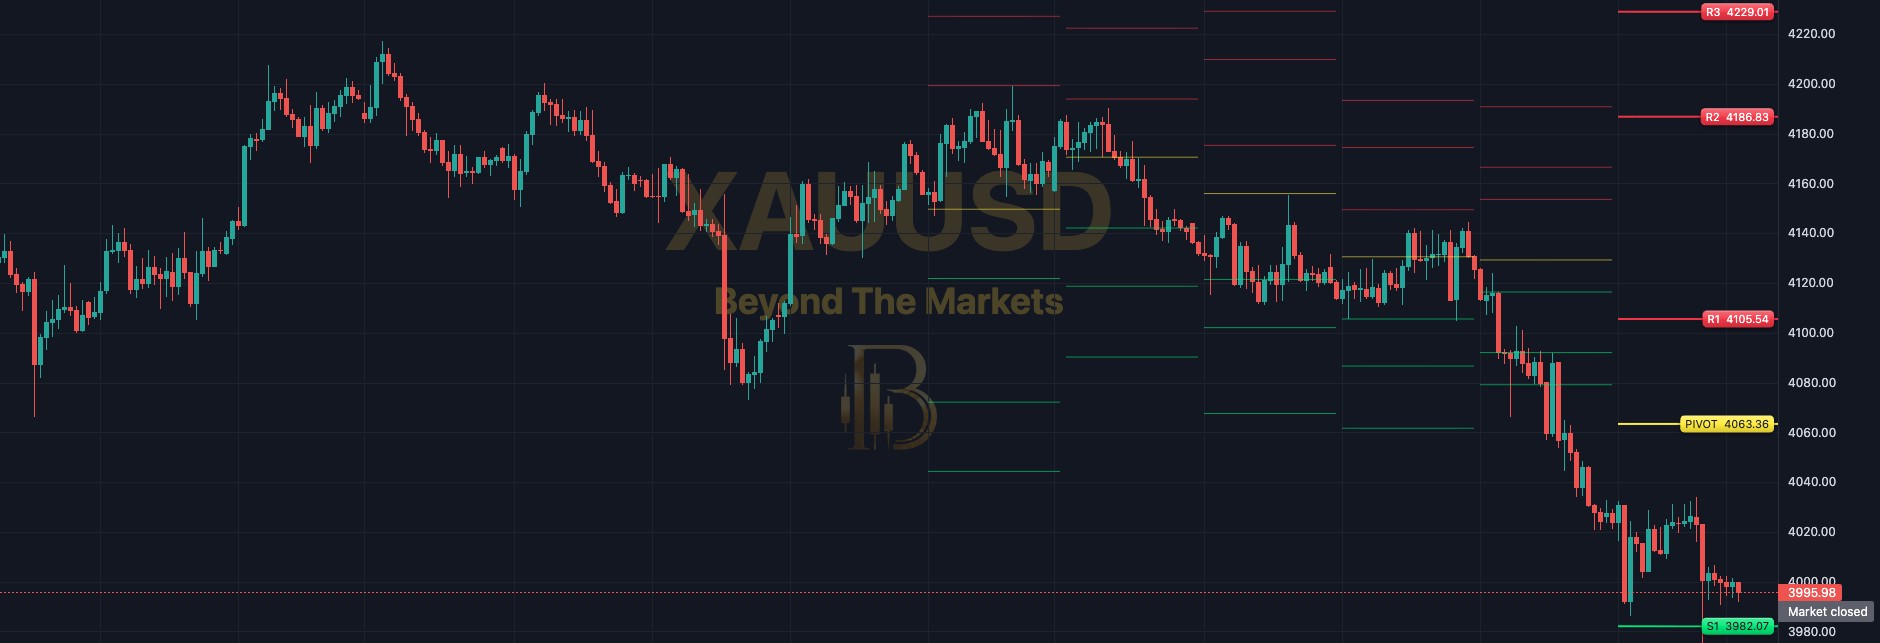 WHAT YOU SEE · GOLD 1H · DAILY PIVOTS
123456
1Yellow PIVOT line: the main level: the average of yesterday’s high, low and close.
2Red R1, R2, R3: resistance levels above the pivot: possible ceilings. R3 is the furthest away.
3Green S1, S2, S3: support levels below the pivot: possible floors. S3 is the furthest away.
4Price tags: each of today’s lines shows its name and price at the right-hand end.
5Faded lines: the previous 5 days’ levels, thinner and paler, so you can see how price reacted.
6New day, new levels: when a day starts, the lines step to new prices from the day just finished.
Use it in 5 steps
- Switch it onOpen Charts → Basic Indicators → tick Pivot Points. Use a chart below daily, for example 15-minute or 1-hour.
- Above or below the pivot?Above the yellow PIVOT: R1 is the next ceiling to watch. Below it: S1 is the next floor to watch.
- Watch the reactionAt a level, wait for a candle to close. A long wick and a close back away hints at a bounce. A close through hints at a break.
- Plan stop and targetPut your stop just beyond the level you trade from. The next level along makes a simple first target.
- Check the faded daysFaded lines show where price bounced or broke before. For bigger levels, pick Weekly or Monthly in ⚙ settings.
A level at work
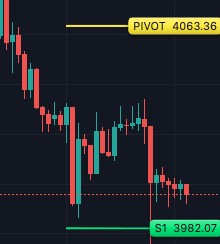
Gold 1H, 23 Oct. Price opened under the yellow PIVOT and slid down to S1. Candles dipped to it and bounced back above it.
⚙ Pivot Points
Levels
Pivot timeframeDaily
Show Pivot✓ On
Show R1 / S1✓ On
Show R2 / S2✓ On
Show R3 / S3✓ On
Style
Previous periods to show5
Show the price in the labels✓ On
Left extension (bars, dotted)0
Pivot colour#FFEB3B
Resistance colour#F23645
Support colour#00E676
Settings worth knowing
- Pivot timeframe: Daily (default) uses yesterday. Weekly uses last week, Monthly last month.
- Show R1 / S1, R2 / S2, R3 / S3: untick pairs you don’t use to keep the chart clean.
- Previous periods to show: 5 by default. 0 shows only the current levels.
- Left extension: a dotted line back into the previous day.
- Show the price in the labels: on by default. Untick it for name-only tags.
Golden rules
- A level is a place to watch, not a reason to trade. Let a closed candle show you which way.
- Never skip the stop loss. Risk 1% of your account or less per trade.
- Skip big news times (rate decisions, NFP): price can rip through several levels at once.
- Practise first with the Replay button: trade old candles for free.
🔔 Get told when it happens: click Alerts (the bell), choose Pivot Points and tick “Crosses above PIVOT” and “Crosses below PIVOT” (R1 and S1 have their own).
For educational purposes only. The results in this guide come from testing on past prices. Past performance does not guarantee future results, and real spreads, slippage and delays can make results worse. Nothing here is financial advice, and trading carries a high risk of losing money. Read the risk warning.