



INDICATOR · BEGINNER GUIDE
POC
Shows just one thing: the Point of Control, the busiest price of the day, where the most trading happened. One bright purple line, with its price in white.
◆The busiest price◆Today, this week or last X bars◆Any market & timeframe◆Cross alert
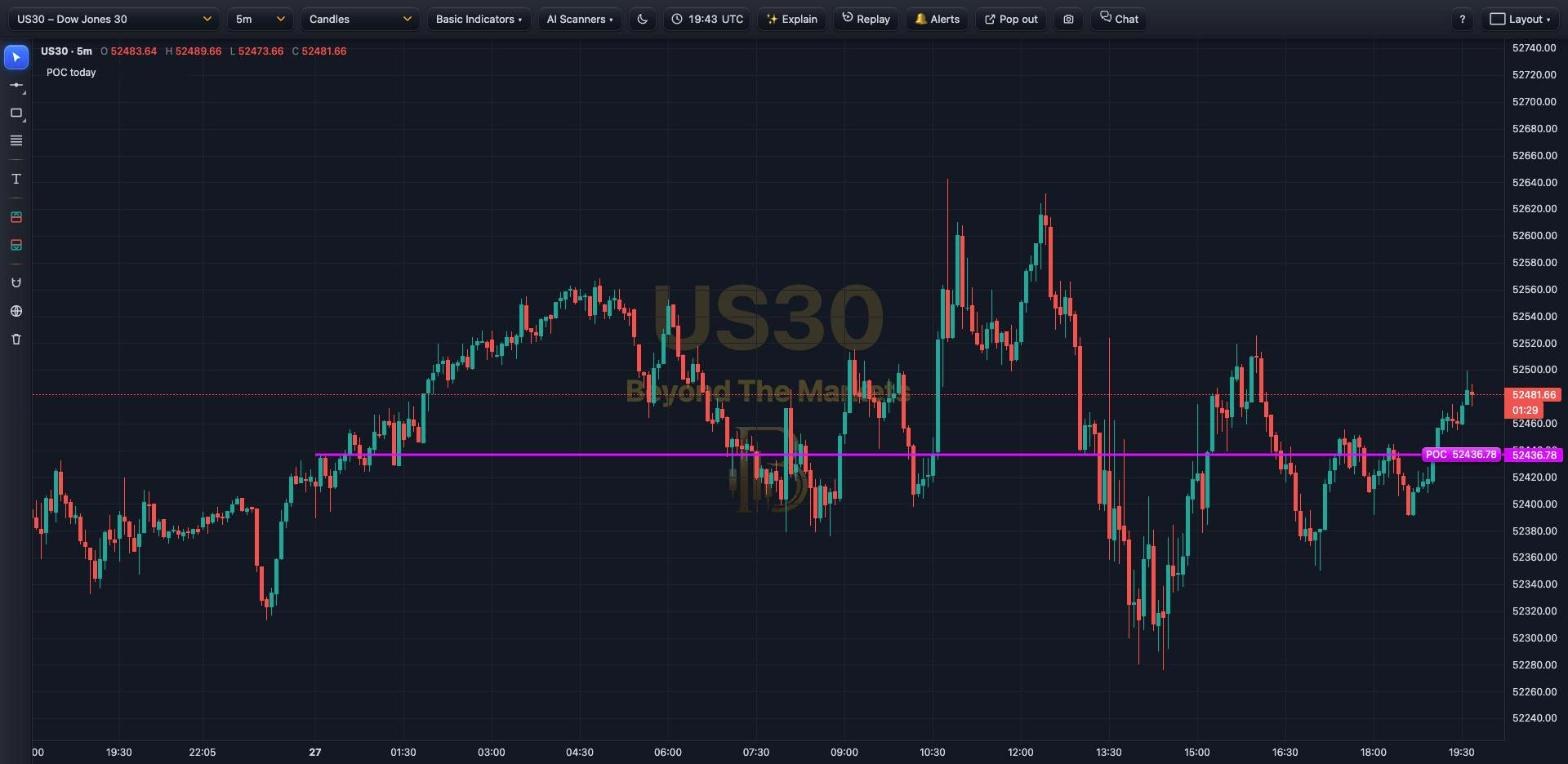 WHAT YOU SEE · US30 5m · POC TODAY
12345
1The POC line: the price where the most volume traded in the period, in bright purple.
2The POC tag: its exact price in white, also shown on the price scale.
3Start of the period: today starts at 00:00 UTC (midnight UK time in winter).
4Below the POC: sellers had the upper hand here. Above it, buyers did.
5Price meets the POC: price is often pulled back to it, and it can act as support or resistance.
Use it in 5 steps
- Add itBasic Indicators → tick POC (Point of Control). It works on every market and timeframe.
- Find the busiest priceThe purple line is where most of today’s trading happened: the price the market has agreed on so far.
- Above or below?Price above the POC = buyers have the upper hand. Below = sellers do.
- Choose the period⚙ → POC covers: Today, This week or Last X bars. Draw the line from the start of the period or across the whole chart.
- Get the alert🔔 Alerts → Price crossed the POC, or add it in My alerts for any market.
What is the POC?
- The price row with the most volume in the period. Markets with no volume use time at price.
- It moves during the day as trading builds up, and settles as the day goes on.
- Many traders watch it as a magnet in quiet markets and as support or resistance.
- It is the same POC as the Volume Profile shows (Medium detail).
Colours: line, tag text and thickness can all be changed in ⚙. On daily and higher charts it uses the last X bars.
Good to know
- Early in the day the POC jumps around: give it an hour or two.
- Price far from the POC often drifts back to it when the market goes quiet.
- Want the value area too? Add the Volume Profile.
Good questions for ✨ Explain
- “Is price above or below the POC?”
- “Has the POC acted as support today?”
- “How far is price from the POC?”
Golden rules
- The POC is a level, not a buy or sell signal.
- Wait for price to react at it before you act.
- Risk 1% or less per trade.
Tip: use the POC with your AI scanners: a signal near the POC has a clear level to trade from.
For educational purposes only. The results in this guide come from testing on past prices. Past performance does not guarantee future results, and real spreads, slippage and delays can make results worse. Nothing here is financial advice, and trading carries a high risk of losing money. Read the risk warning.