



INDICATOR · BEGINNER GUIDE
PREVIOUS HIGHS & LOWS
Yesterday’s, last week’s and last month’s high and low, drawn for you.
◆PDH · PDL◆PWH · PWL◆PMH · PML◆Forex day 5pm NY
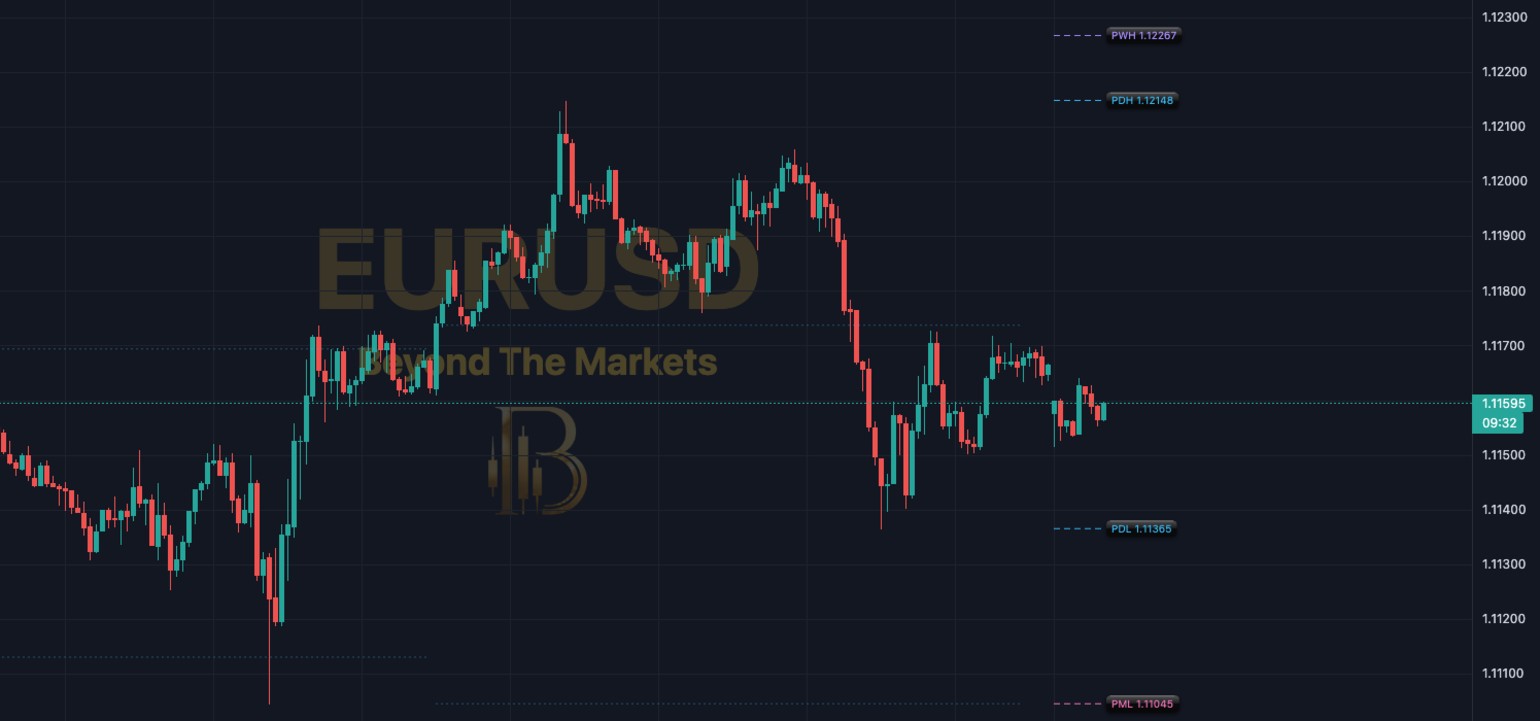 WHAT YOU SEE · EURUSD 15M · 28 OCT–2 NOV
123456
1Purple line (PWH): last week’s high.
2Blue line (PDH): yesterday’s high.
3Friday’s top: where that high came from.
4Blue line (PDL): yesterday’s low.
5Pink line (PML): last month’s low.
6Lines start: at the start of today.
Use it in 5 steps
- Switch it onCharts → Basic Indicators (ƒx) → tick Previous Highs & Lows.
- Read the linesBlue = day, purple = week, pink = month. H = high, L = low.
- Inside or out?Inside yesterday’s range: watch both edges. Outside: a breakout.
- Look for ✓A ✓ means price went past it. Back inside soon after = a possible sweep.
- Plan around themMany traders put stops beyond these levels, not on them.
Friday’s range becomes Monday’s lines
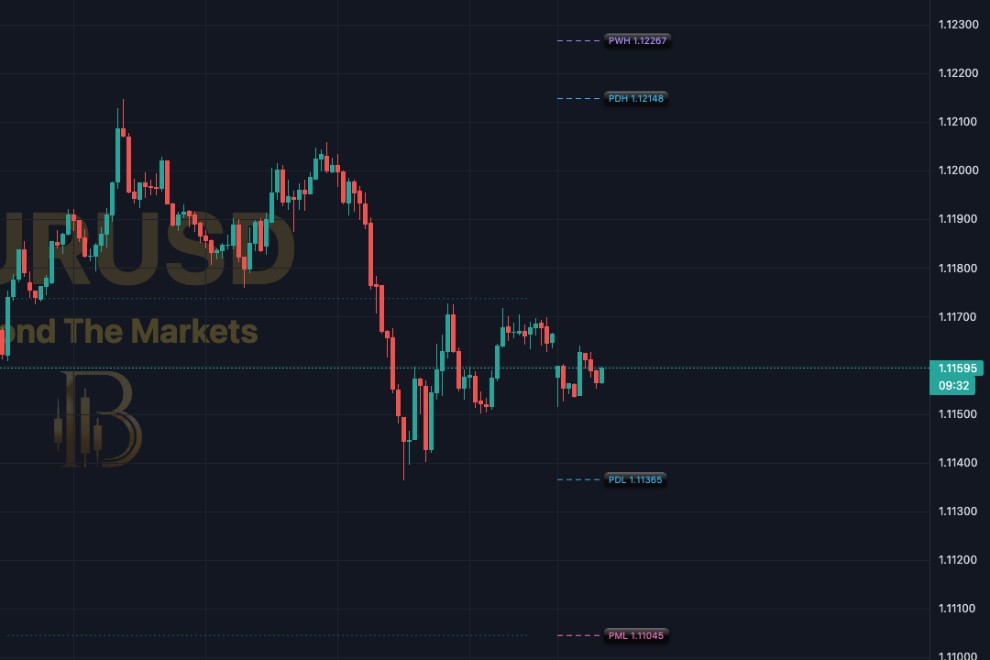
EURUSD 15m, Mon 2 Nov. Friday’s high (1.12148) and low (1.11365) are now Monday’s PDH and PDL. Price opened inside that range.
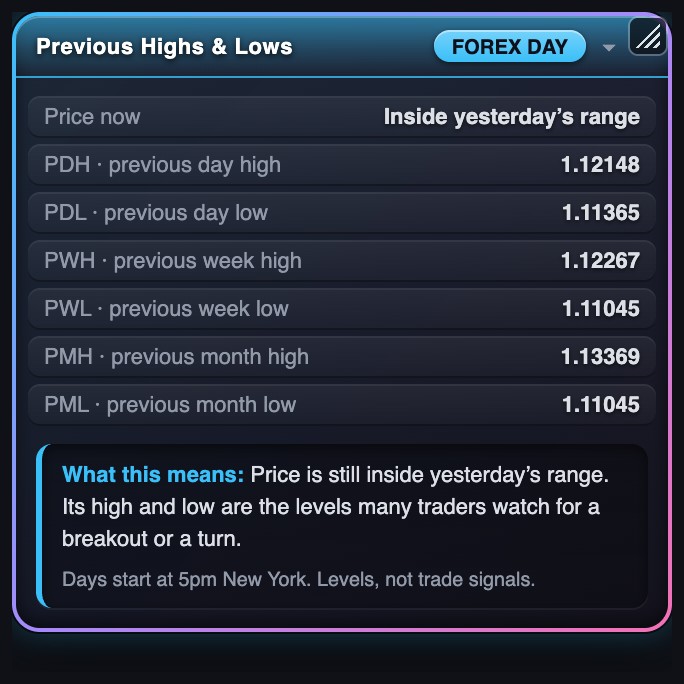
The dashboard
- Price now: inside, above or below yesterday’s range.
- PDH / PDL: yesterday’s high and low.
- PWH / PWL: last week’s high and low.
- PMH / PML: last month’s high and low.
- taken ✓: price has traded past that level today.
Golden rules
- Levels, not signals. Price can turn at them or run straight through.
- Day start matters: 5pm New York is the forex standard. You can pick midnight UK or UTC.
- Works on 1 day and below for daily levels; week and month on bigger charts.
- Always use a stop loss and risk 1% or less per trade.
🔔 Get told when it fires: click Alerts, choose Previous Highs & Lows and tick “Closed above the previous day high” and “…below the previous day low”.
For educational purposes only. The results in this guide come from testing on past prices. Past performance does not guarantee future results, and real spreads, slippage and delays can make results worse. Nothing here is financial advice, and trading carries a high risk of losing money. Read the risk warning.