



INDICATOR · BEGINNER GUIDE
RSI
A 0 to 100 speed meter under the chart. Above 70, price is stretched up (overbought). Below 30, stretched down (oversold).
◆14 candles, 0 to 100◆Lines at 70 and 30◆Own pane under chart◆Switched on by default
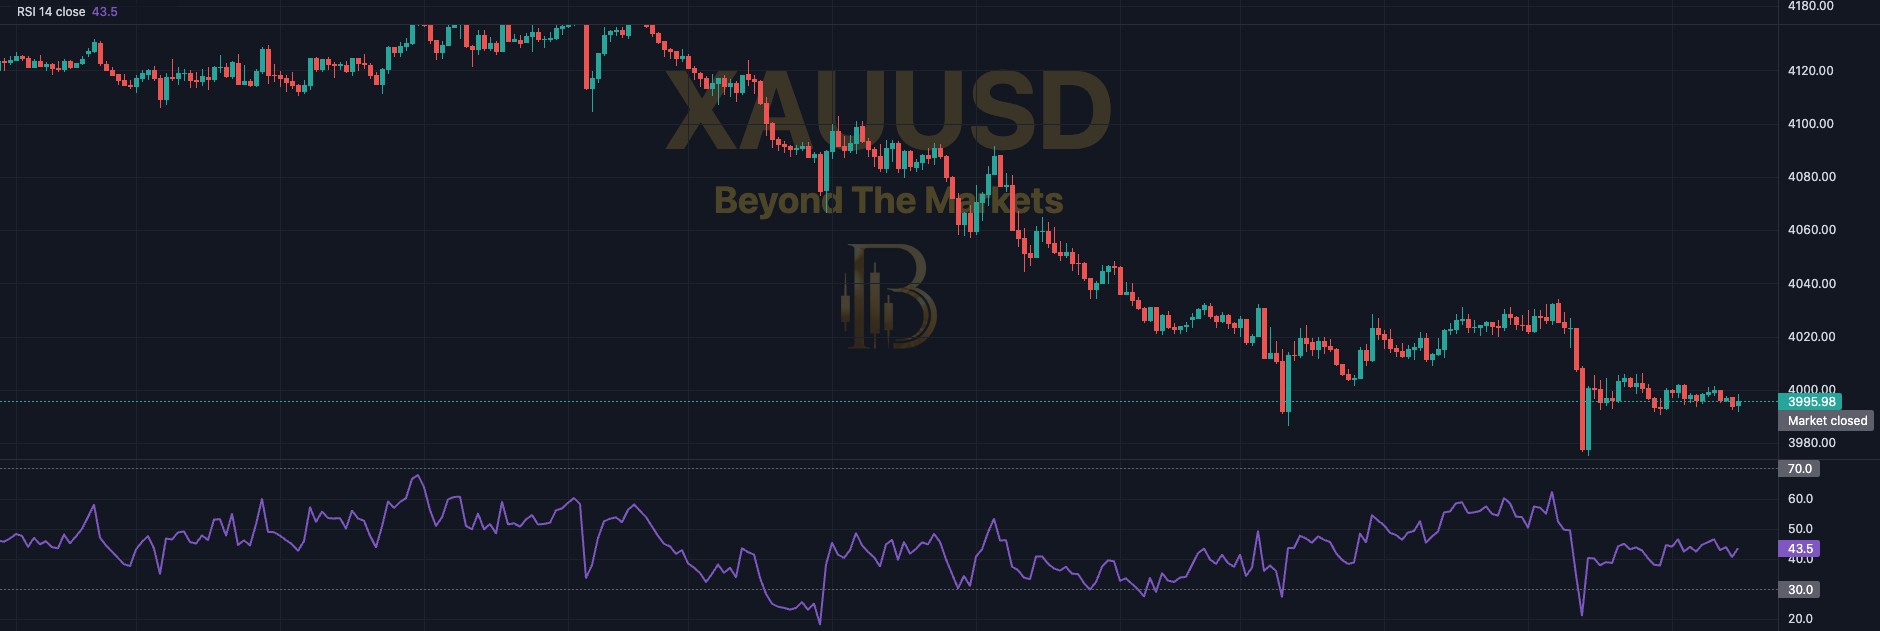 WHAT YOU SEE · GOLD 15m · PRICE + RSI PANE
123456
1Purple line: the RSI 14. It climbs when recent closes are mostly up and drops when they are mostly down.
270 line (top): above it = overbought. Price has risen fast and is stretched.
330 line (bottom): below it = oversold. Price has fallen fast and is stretched.
4In between: normal. Above 50 leans up, below 50 leans down.
5Name and value: top left reads RSI 14 close; the purple tag on the right is the latest value.
6Turning back: RSI dropping back under 70, or rising back over 30, shows the push is fading.
Use it in 5 steps
- Switch it onIt is on the first time you open a chart. If not: Open Charts → Basic Indicators (ƒx) → tick Relative Strength Index (RSI). It opens in its own pane.
- Check the trend firstLook at the price chart before the RSI. In an uptrend, RSI can stay above 70 for a long time. Overbought is not ‘about to fall’.
- Buy dips in an uptrendIn an uptrend, look for buys when RSI dips towards 50 or 30 and turns back up. Do the mirror image for sells in a downtrend.
- Wait for the turnDo not buy just because RSI is below 30. Wait for it to rise back above 30 and for a candle to close up.
- Set your stop on priceRSI cannot tell you where your stop goes. Use the last swing high or low on the price chart.
Reading oversold
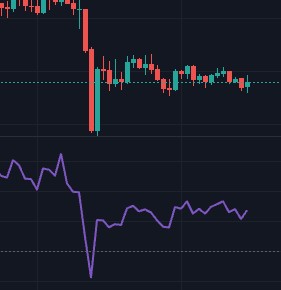
Gold 15m, 23 Oct. A big drop pushed RSI under 30. It then rose back above 30 as price steadied: the push was fading.
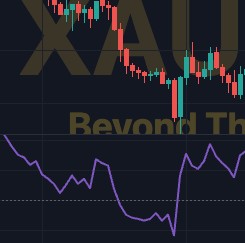
The oversold trap
- Here RSI stayed below 30 for many candles, yet price kept falling.
- Oversold means weak, not cheap. Buying just because RSI is low fights the trend.
- Wait for RSI to rise back above 30 and for price to start climbing before thinking of a buy.
- The Upper level and Lower level can be moved with ⚙ if your market rarely reaches them.
- Tip: the alert “RSI rises back above the lower level” catches that turn.
Golden rules
- Overbought is not a sell signal. Always check the trend on the price chart first.
- Never skip the stop loss. Risk 1% of your account or less per trade.
- Beware news. One big news candle can throw RSI from one end to the other.
- Practise first with the Replay button: play old candles forward and trade them for free.
🔔 Get told when it fires: click Alerts, choose Relative Strength Index (RSI) and tick “RSI crosses above the upper level (overbought)” or “RSI crosses below the lower level (oversold)”.
For educational purposes only. The results in this guide come from testing on past prices. Past performance does not guarantee future results, and real spreads, slippage and delays can make results worse. Nothing here is financial advice, and trading carries a high risk of losing money. Read the risk warning.