



SMC MAP · BEGINNER GUIDE
SMC MAP
Smart Money Concepts drawn for you: structure, liquidity, sweeps, fair value gaps, order blocks and premium / discount. A map of where the big orders sit, so you can plan your own trades.
◆BOS & CHoCH◆Liquidity◆Sweeps◆FVGs & order blocks◆Premium / discount
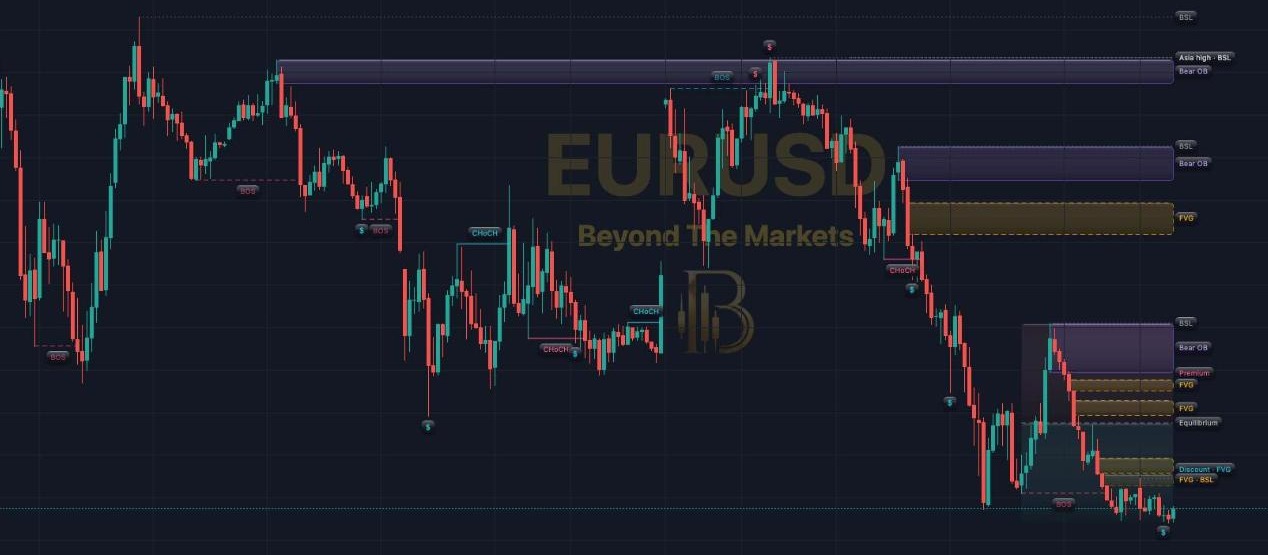 WHAT YOU SEE · EURUSD 15m
123456
1BOS / CHoCH: a close through a swing. CHoCH (solid) = trend changed; BOS (dashed) = trend continued.
2Liquidity: dotted lines at untouched highs (BSL) and lows (SSL). EQH / EQL, Asia and PDH / PDL are strongest.
3Sweep $: price ran through liquidity and closed back inside, so the stops there were taken.
4Order block: the last opposite candle before a structure break. Fades once revisited.
5Fair value gap: a three-candle gap price often revisits. Fades once touched, goes when filled.
6Premium / discount: the current leg. Top half premium, bottom half discount, dashed line = 50%.
Use it in 5 steps
- Add itBasic Indicators → SMC Map. Any market; 15m to 4H reads best.
- Read the biasThe panel shows the higher-timeframe trend and this chart’s structure. Trade only when they agree.
- Find the liquidityPrice is drawn to the dotted lines. The panel names the nearest above and below.
- Wait for the sweepA $ against the trend, then a CHoCH back with it: the stops are gone and the trend resumes.
- Plan from a zoneBuy in discount at a bullish FVG or OB, sell in premium at a bearish one. Stop beyond the zone.
The SMC story in one picture
1 Stops under the lows are taken ($). 2 Price closes back above a swing high (CHoCH). 3 It pulls back into a gap or order block in discount. 4 The next target is the liquidity above.
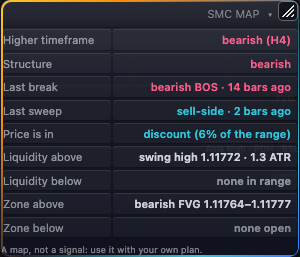
Reading the SMC Map panel
- Higher timeframe / Structure: the 4H trend and this chart’s trend.
- Last break / sweep: the latest BOS or CHoCH and $, in candles ago.
- Price is in: premium or discount, as a % of the leg.
- Liquidity above / below: the nearest untouched pool each side, in ATR.
- Zone above / below: the nearest open gap or order block.
Golden rules
- A map, not a signal. In our tests SMC patterns alone did not give a reliable edge; use it with an AI scanner or your own plan.
- Wait for the close. Breaks and sweeps count on a closed candle, and nothing repaints.
- Risk 1% or less per trade, stop beyond the zone or sweep wick.
Tip: too busy? In settings, untick ordinary swing highs / lows to keep only the strong pools. Alerts for CHoCH and sweeps are ready in Alerts.
For educational purposes only. The results in this guide come from testing on past prices. Past performance does not guarantee future results, and real spreads, slippage and delays can make results worse. Nothing here is financial advice, and trading carries a high risk of losing money. Read the risk warning.