



INDICATOR · BEGINNER GUIDE
SUPERTREND
One line that follows the trend: under price when it is going up, over price when it is going down. It flips when a candle closes through it.
◆ATR 10 × 3, like TradingView◆Flips on the candle close◆Choppy-market warning◆5m to 1M table
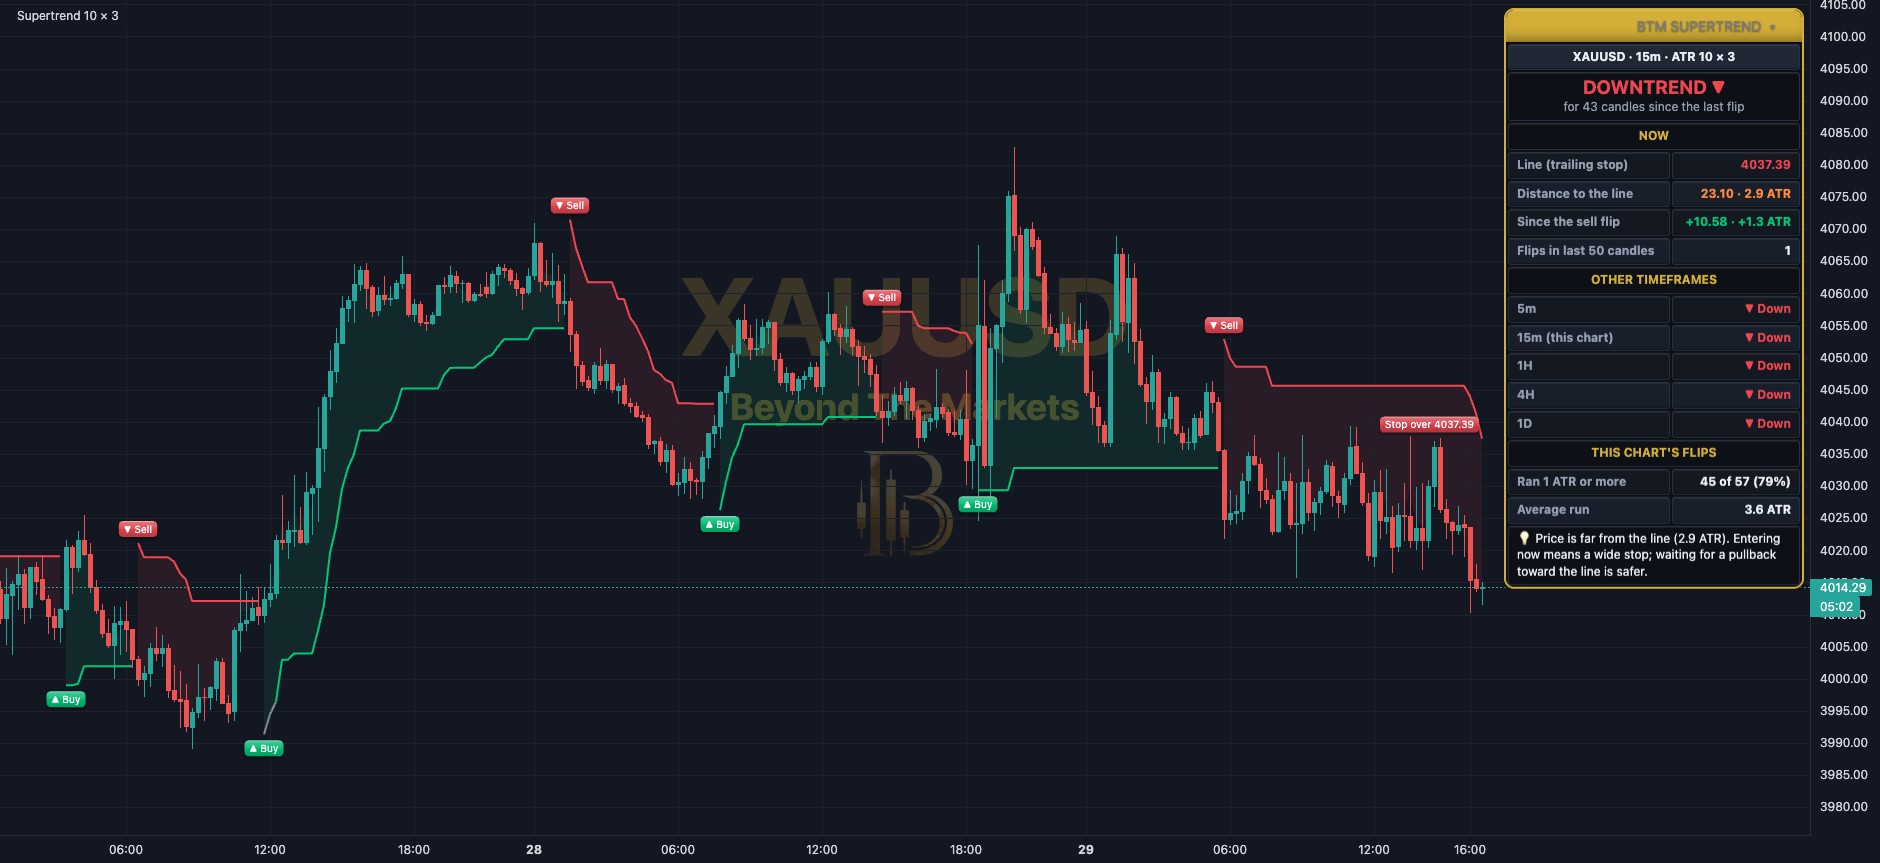 WHAT YOU SEE · GOLD 15m · 29 OCT
123456
1Uptrend: a green line under price. It only moves up.
2Buy flip: a candle closed above the red line, so the trend turned up.
3Sell flip: a candle closed below the green line, so the trend turned down.
4Downtrend: a red line over price, with red shading. It only moves down.
5Your stop: the line now: Stop over 4037.39 for a sell.
6The dashboard: the trend, how long it has lasted and how far price is from the line.
Use it in 5 steps
- Switch it onOpen Charts → Basic Indicators (ƒx) → tick Supertrend. 15m to 4H charts work best.
- Trade with the colourGreen: buys only. Red: sells only. A grey line means choppy: stand aside.
- Enter near the lineThe closer price is to the line, the smaller the stop. Over 2.5 ATR away? Wait for a pullback.
- Stop beyond the linePut the stop just beyond the line and move it with the line each candle.
- Check bigger timeframesWhen most of the 5m to 1M table agrees, a flip is more likely to run.
Riding a gold rally
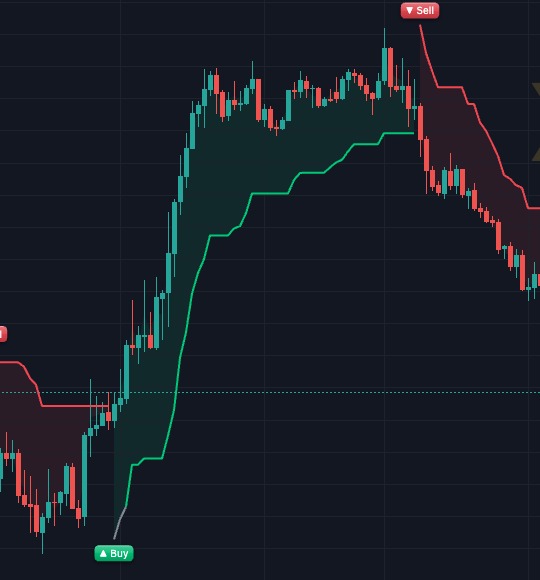
Gold 15m, 27–28 Oct. A Buy flip near $4,000 just before 12:00 UTC. The green line trailed under price as gold rallied about $70; a Sell flip early on the 28th ended it.
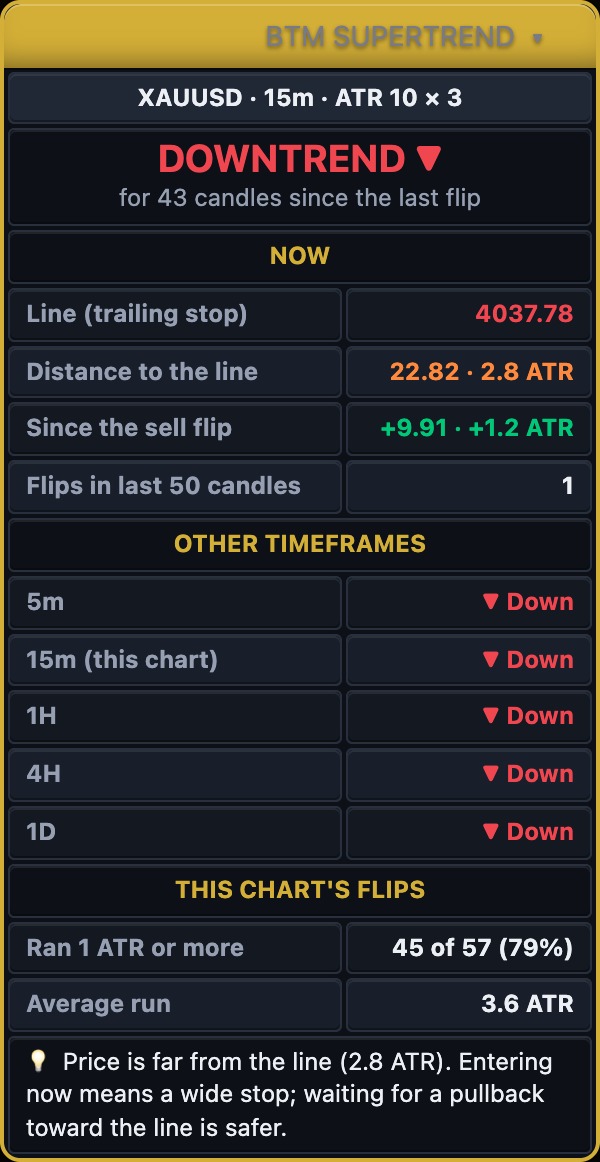
The dashboard
- Uptrend / Downtrend and candles since the last flip. FLIP POSSIBLE = the live candle is through the line.
- Line (trailing stop) and how far price is from it, in price and ATRs.
- Since the flip: how far price has moved since the last Buy or Sell.
- Other timeframes: the Supertrend on 5m, 15m, 1H, 4H, 1D, 1W and 1M.
- This chart’s flips: how many ran 1 ATR or more before the next flip.
Golden rules
- Supertrend loses in ranges. Lots of flips or a grey line: stand aside.
- Don’t chase. Far from the line = a big stop. Wait for price to come back.
- Always use a stop loss and risk 1% of your account or less per trade.
- Practise first with the Replay button: trade old candles for free.
🔔 Get told when it fires: click Alerts, choose Supertrend and tick “Supertrend turned up” or “Supertrend turned down”.
For educational purposes only. The results in this guide come from testing on past prices. Past performance does not guarantee future results, and real spreads, slippage and delays can make results worse. Nothing here is financial advice, and trading carries a high risk of losing money. Read the risk warning.