



INDICATOR · BEGINNER GUIDE
S&D SCORECARD
Draws supply and demand zones, grades each A, B or C, and marks BUY and SELL reactions off them.
◆Zones scored out of 8◆Grades A, B and C◆BUY / SELL zone reactions◆⚡ Sweep confluence marks
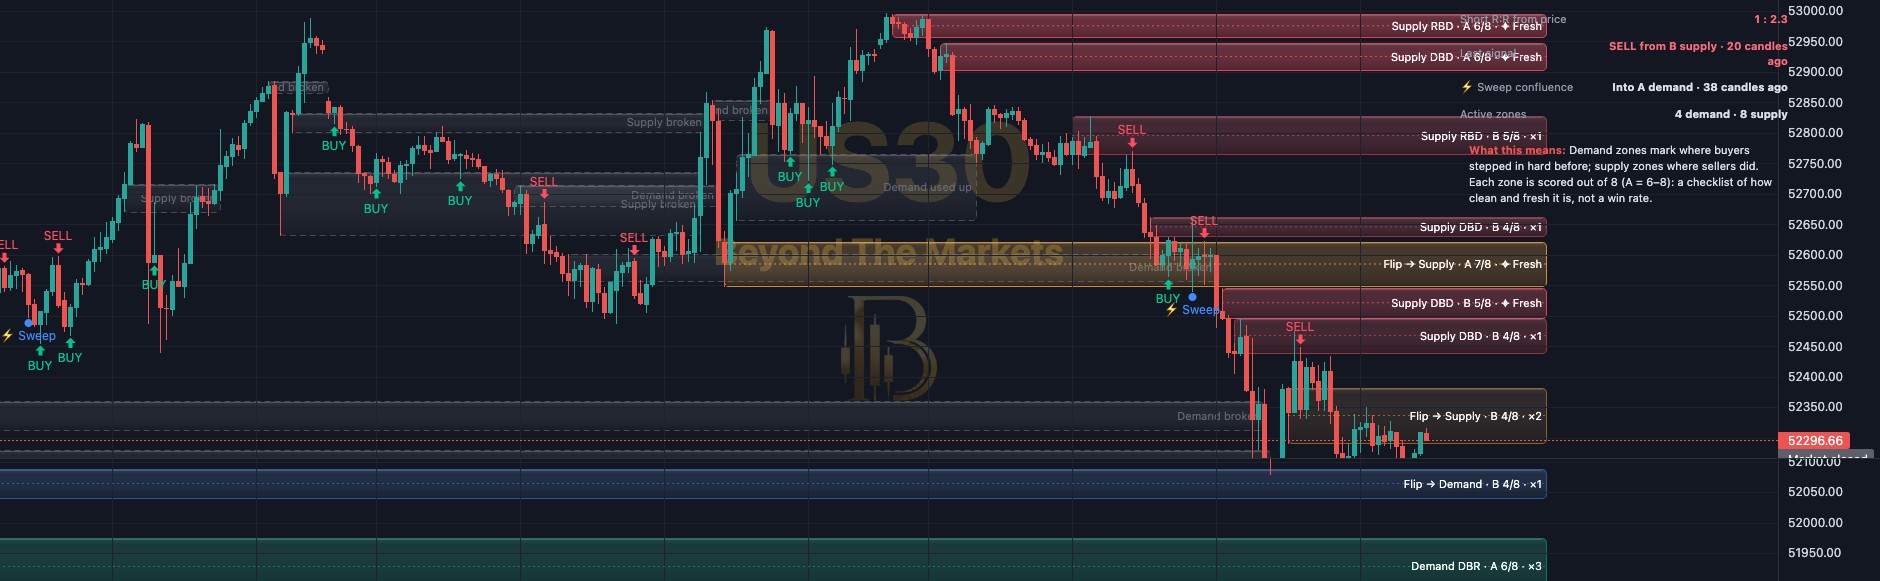 WHAT YOU SEE · US30 15m
123456
1Green zone: demand. Buyers stepped in hard here before. Buy ideas come from these.
2Red zone: supply. Sellers stepped in hard here before. Sell ideas come from these.
3Zone label: pattern, grade and score, then ✦ Fresh (untouched) or ×1, ×2 (times retested).
4Blue / orange zones: a broken zone that has flipped sides. Grey dashed boxes are old, retired zones.
5BUY / SELL arrows: price tapped a zone, then a candle closed back out of it. BUY from demand, SELL from supply.
6⚡ Sweep dot: a recent low (or high) was swept and price snapped back, right at a zone. Extra confluence.
Use it in 5 steps
- Switch it onOpen Charts → Basic Indicators → tick Supply & Demand Scorecard. Zones appear on the price chart with the scorecard top right.
- Read the gradeEach zone scores out of 8: A = 6–8, B = 4–5, C = 0–3. Only A and B are drawn. ✦ Fresh zones have not been retested yet.
- Wait for the reactionBUY appears when price dips into demand and a rising candle closes back above it within 5 candles. SELL mirrors it.
- Stop beyond the zonePut your stop loss just below a demand zone (above supply). A close through it breaks the zone. Check the R:R rows first.
- Trade with the trendThe header pill says ▲ Uptrend or ▼ Downtrend (200 EMA). Favour buys from demand in an uptrend, sells from supply in a downtrend.
Reading a signal
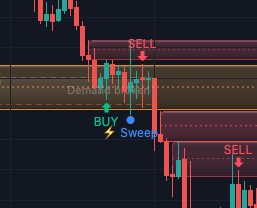
US30 15m, 23 Oct. Price dipped into a demand zone and closed back up: a green BUY with a ⚡ Sweep dot. Later a red SELL came from the supply zone above.
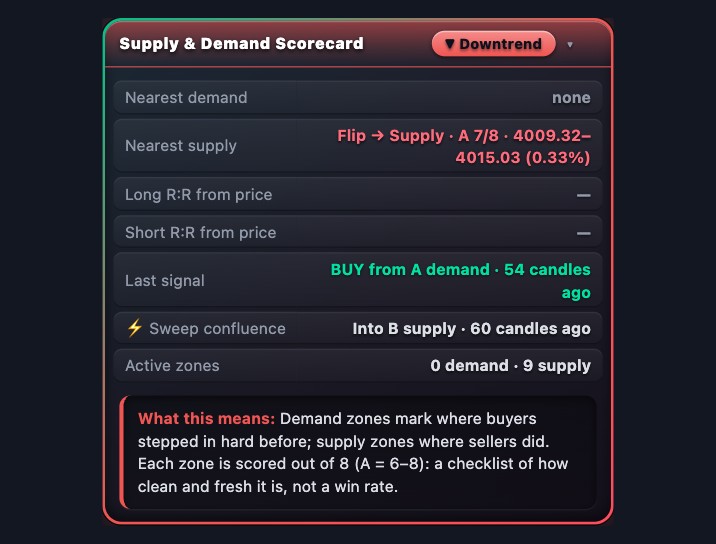
The scorecard
- Trend pill: ▲ Uptrend or ▼ Downtrend: price above or below the 200 EMA.
- Nearest demand / supply: the closest zone each side, its grade, price range and % distance.
- Long / Short R:R from price: reward to risk if you entered now, stop beyond the near zone, target the far one.
- Last signal and ⚡ Sweep confluence: the latest of each and how many candles ago.
- What this means: a plain-English read. Click the title bar to hide the panel.
Golden rules
- A grade is a checklist, not a win rate. An A zone can still break.
- Zones wear out. Each retest weakens a zone; after 3 retests it is retired.
- Never skip the stop loss. Risk 1% of your account or less per trade.
- Practise first with the Replay button: play old candles forward and watch zones being tested.
🔔 Get told when it fires: click Alerts (the bell), choose Supply & Demand Scorecard and tick “BUY reaction from a demand zone” and “SELL reaction from a supply zone”.
For educational purposes only. The results in this guide come from testing on past prices. Past performance does not guarantee future results, and real spreads, slippage and delays can make results worse. Nothing here is financial advice, and trading carries a high risk of losing money. Read the risk warning.