



AI SCANNER · BEGINNER GUIDE
BTM TREND MPH
A car-style head-up display: one big speed number shows how much every trend tool agrees, with dials for each tool and a warning when a move is stretched.
◆Speed 0–100 MPH◆Five trend tools compared◆Trend table, 1m to 1M◆Confirms direction, no signals
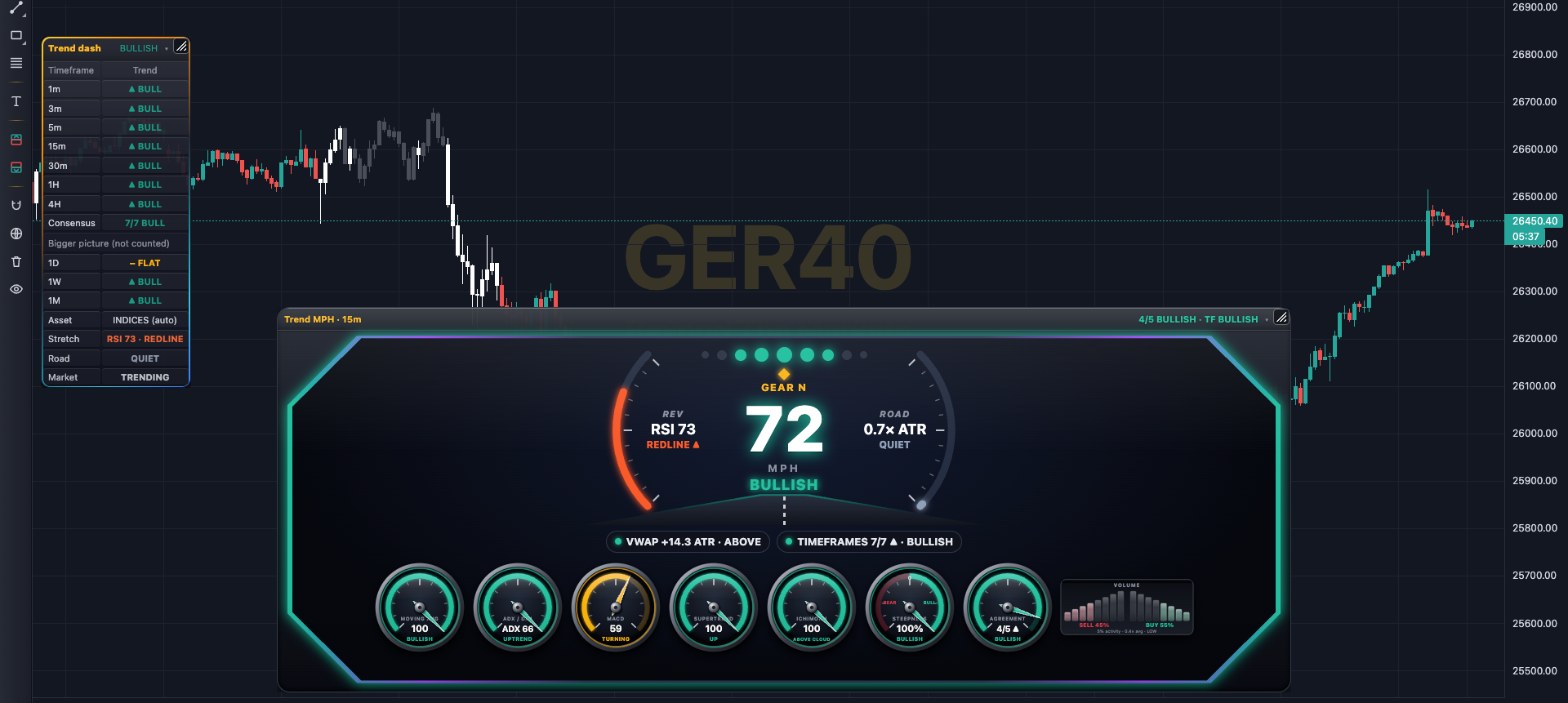 GER40 15m
12345678910
1Speed: 0 to 100 MPH. The faster, the more of everything agrees. Green BULLISH, red BEARISH, under 10 MIXED.
2Lights and gear: more lights the faster it reads. Gear D = higher highs, R = lower lows, N = mixed.
3Rev: RSI. REDLINE = the move is stretched, so don’t chase.
4Road: how busy the market is: QUIET, NORMAL or WILD.
5VWAP and timeframes: price against today’s average (1m–15m charts) and how many of 7 timeframes agree.
6Five tool dials: Moving average, ADX, MACD, Supertrend and Ichimoku. Ring green = up, amber = unsure, red = down.
7Steepness dial: needle left = BEAR, right = BULL, top = FLAT.
8Agreement dial: how many of the five tools agree. 4/5 or 5/5 = a clear direction.
9Volume meter: red bricks = selling share, green = buying share.
10Trend dash: the trend on seven timeframes, 1 minute to 4 hours, plus a consensus.
Use it in 5 steps
- Switch it onOpen Charts → AI Scanners → tick BTM – Trend MPH. The dashboard appears at the bottom of the chart, for example GER40 15-minute.
- Read the speedThe faster the big number, the more the tools agree. A high reading in green BULLISH or red BEARISH with 4/5 or 5/5 on the Agreement dial means a clear direction. MIXED or a low speed means wait.
- Check it is trendingGrey candles, a FLAT Steepness dial, a QUIET Road gauge or RANGING in the table mean no trend. Trend tools work poorly here.
- Check the bigger pictureLook at the Trend dash. A Consensus that matches the dials (e.g. 5/7 BULL) means the timeframes line up.
- Use it to confirmIt shows direction only, no entries. Only take your own trade ideas that go the same way, and always set a stop loss.
The HUD screen
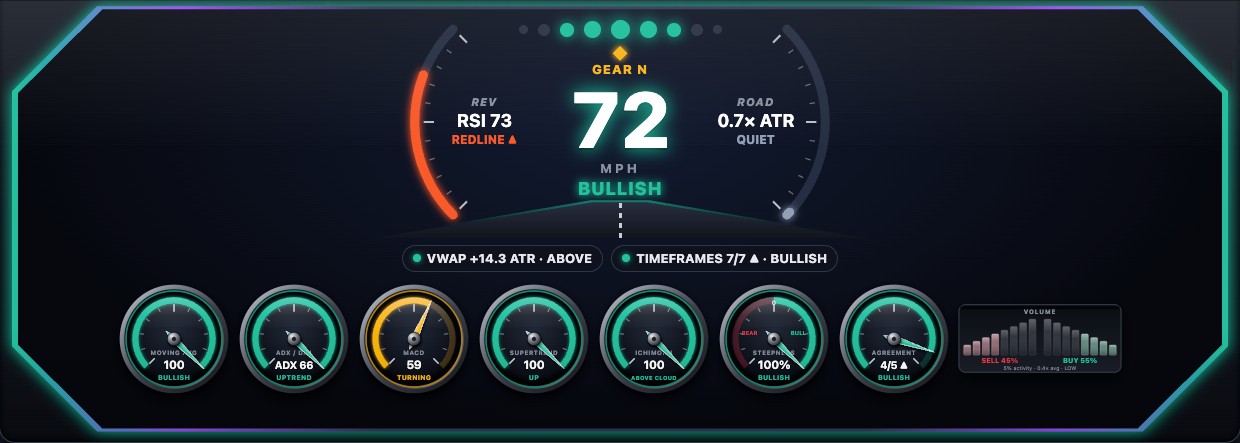
Speed adds up every dial, the timeframes, gear, VWAP and volume: 0 MPH = they disagree, 100 MPH = they all point the same way. Rev: in the red the move is stretched, so don’t chase. Road: quiet, normal or wild. Prefer the old dials? ⚙ Settings → Dashboard look → Classic.
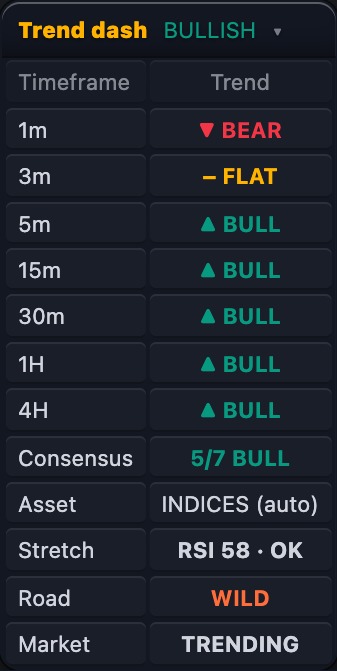
The Trend dash table
- Each row checks that timeframe’s last closed candle against its 50 EMA (an average) and whether that average is rising.
- ▲ BULL = above and rising, ▼ BEAR = below and falling, – FLAT = neither.
- Consensus needs 5 of the 7 timeframes to agree, otherwise it says MIXED.
- Asset = the market type it found. Stretch and Road repeat the top gauges; Market says TRENDING or RANGING.
- Click the title bar to hide or show it.
Golden rules
- Learning? Only act on 4/5 or 5/5 when the candles are not grey and the Rev counter is not in the red.
- Never skip the stop loss. Risk 1% of your account or less per trade.
- Skip big news times (rate decisions, NFP).
- Practise first with the Replay button: play old candles forward and trade them for free.
🔔 Get told when it fires: click Alerts, choose BTM – Trend MPH and tick “Dials agree BULLISH”, “Gear shifts to D” or “Rev counter in the red”.
For educational purposes only. The results in this guide come from testing on past prices. Past performance does not guarantee future results, and real spreads, slippage and delays can make results worse. Nothing here is financial advice, and trading carries a high risk of losing money. Read the risk warning.