



AI SCANNER · BEGINNER GUIDE
BTM TREND HEATMAP
A colour ribbon under your chart shows trend direction and strength at a glance, plus a five-timeframe verdict in plain English.
◆Own panel under the chart◆12 rows, short to long◆Grid from 15m to 1W◆Plain-English verdict
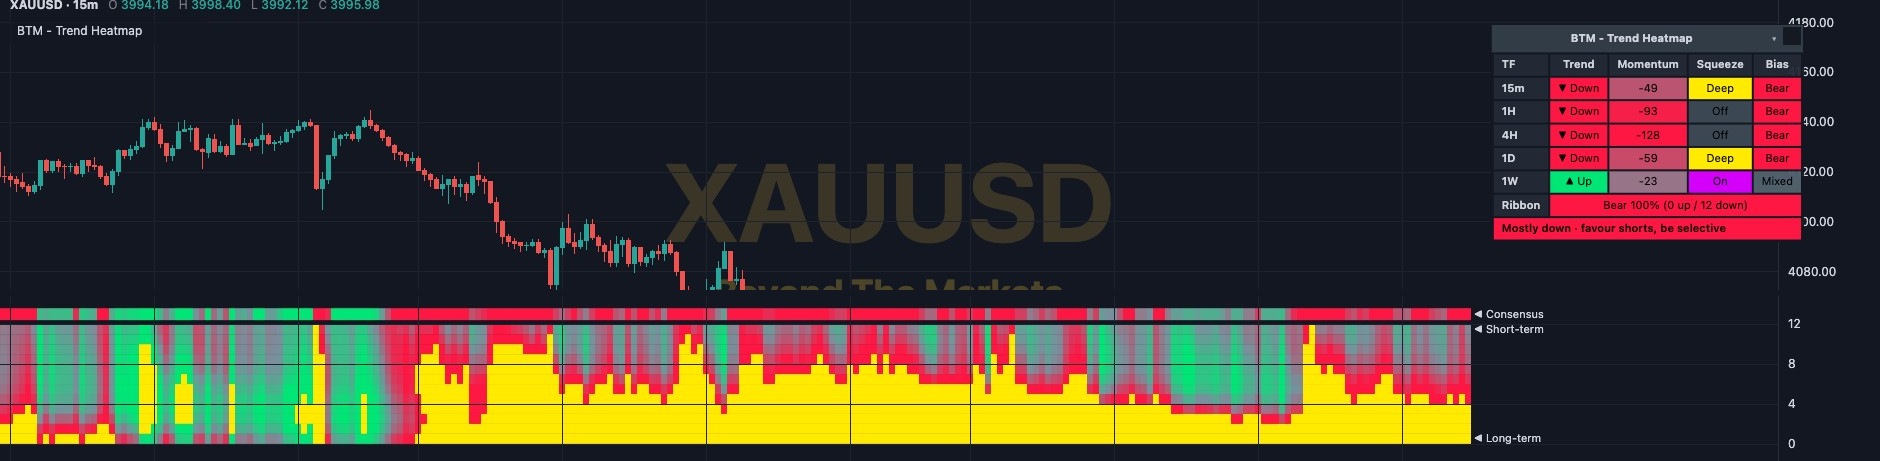 WHAT YOU SEE · GOLD 15m
123456
1The ribbon: 12 rows of colour. Green = price above its average, red = below, grey = flat.
2Short to long term: the top rows react fast, the bottom rows show the long-term trend.
3Brightness & yellow: brighter colour = a stronger move. Yellow = overstretched, price has run far from its average.
4Consensus strip: the thin top line shows how many rows agree. Bright green or red = they mostly agree.
5The grid: trend, momentum, squeeze and bias on five timeframes, from 15 minutes to 1 week.
6The verdict: the bottom line of the grid sums it all up in plain English.
Use it in 5 steps
- Switch it onOpen Charts → AI Scanners → tick BTM – Trend Heatmap. A new panel opens under the chart. Use 15-minute or lower so every grid row fills.
- Read the ribbonMostly green = uptrend, mostly red = downtrend. When the top rows change colour first, the short-term move is turning.
- Check the consensusThe Ribbon row in the grid counts it for you: Bull or Bear, a %, and how many rows are up or down.
- Read the verdictAll timeframes up · look for longs. Mixed · no clear edge means wait. “Mostly” means be selective.
- Trade with itOnly take your own ideas that go the verdict’s way. Don’t chase yellow cells. Always set a stop loss.
Reading the ribbon
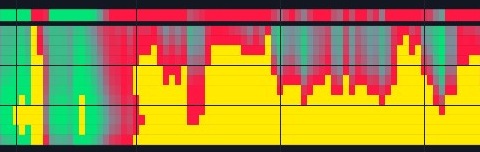
Gold turning down on 22 Oct: the ribbon flips from green to red, and the fast rows at the top change first.
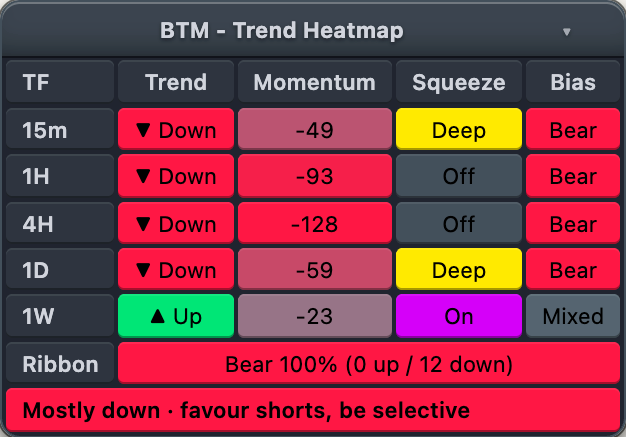
The timeframe grid
- Trend: ▲ Up or ▼ Down, price above or below its 200 EMA (a long-term average).
- Momentum: how hard price is pushing. Beyond ±150 it turns yellow with ⚠ (overstretched).
- Squeeze: Deep (yellow) or On (purple) = price boxed into a tight range; Off = normal.
- Bias: Bull or Bear only when Trend and Momentum agree, otherwise Mixed.
- A row of ‘—’ means that timeframe is below your chart’s. Click the title to hide it.
Golden rules
- Learning? Only trade when the verdict says “All timeframes” or “Mostly”, in that direction.
- Never skip the stop loss. Risk 1% of your account or less per trade.
- Skip big news times (rate decisions, NFP).
- Practise first with the Replay button: play old candles forward and trade them for free.
🔔 Get told when it fires: click Alerts, choose BTM – Trend Heatmap and tick “All grid timeframes bullish” or “All grid timeframes bearish”.
For educational purposes only. The results in this guide come from testing on past prices. Past performance does not guarantee future results, and real spreads, slippage and delays can make results worse. Nothing here is financial advice, and trading carries a high risk of losing money. Read the risk warning.