



INDICATOR · BEGINNER GUIDE
VOLATILITY MOMENTUM
A momentum line measured in average candle sizes, so the same levels work on any market, with trend-filtered long entries.
◆Same levels on any market◆Momentum and pullback longs◆Stretch warning at ±150◆Shorts off by default
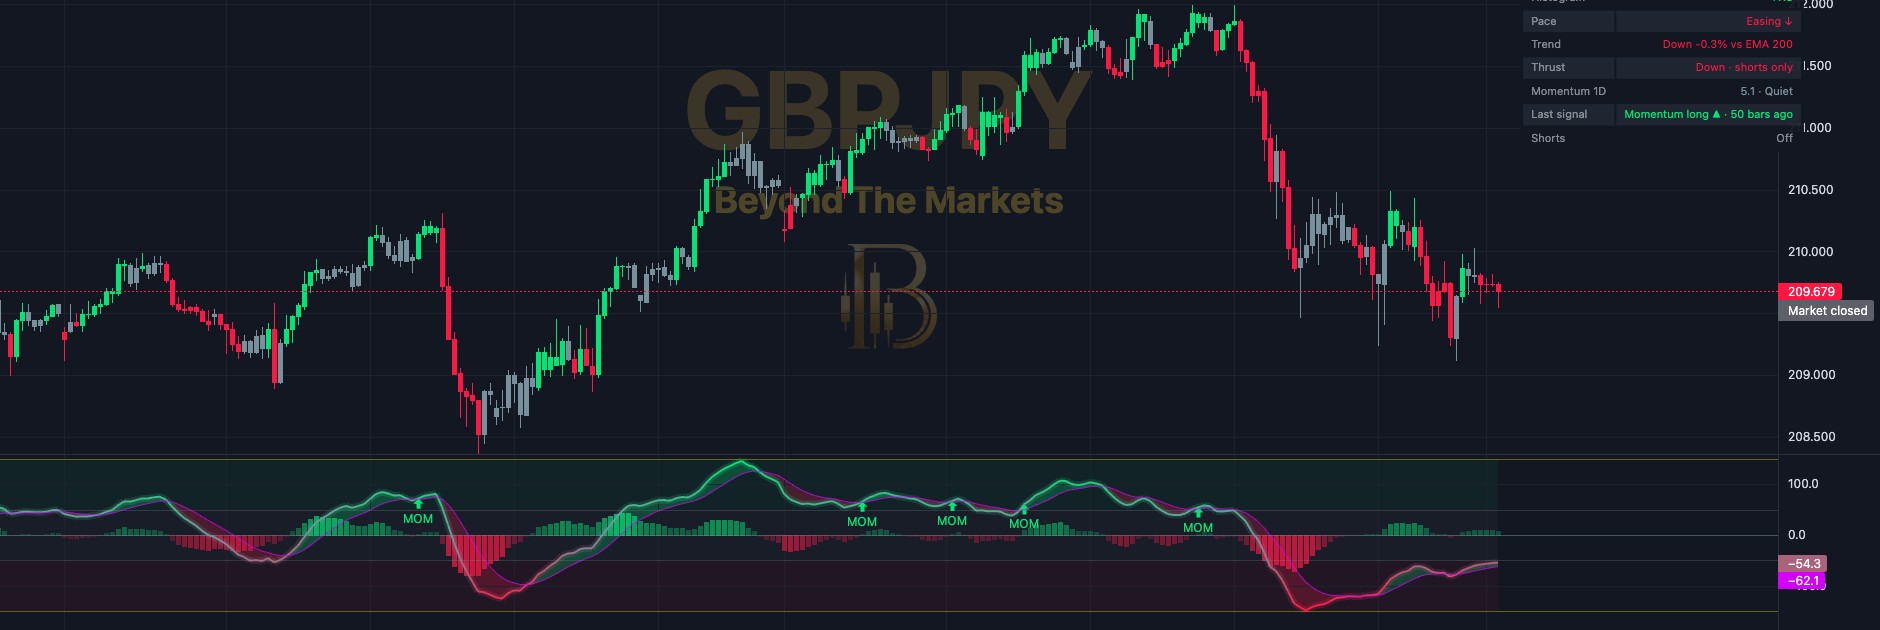 WHAT YOU SEE · GBPJPY 1H · PRICE + MOMENTUM PANE
123456
1Momentum line: green above zero = upward push, red below zero, yellow when stretched past ±150.
2Purple trigger line: a smoothed copy of momentum. The shaded cloud between them is green when momentum leads.
3Histogram columns: the gap between momentum and trigger. Growing green bars = the push is building.
4Shaded levels: grey quiet zone (±50): crosses here are ignored. Beyond ±150 momentum is stretched.
5MOM / PB arrows: MOM = momentum long, PB = pullback long. A yellow dot = leaving the stretch zone.
6Candle colours: green = thrust up (longs allowed), red = thrust down, grey = flat.
Use it in 5 steps
- Switch it onOpen Charts → Basic Indicators → tick Volatility Momentum. It opens in its own pane. Shorts are off until you tick Include shorts.
- Check trend and thrustLongs need price above the 200 EMA (panel Trend row says Up) and no downward thrust. Green candles mean thrust is up.
- Momentum long (MOM)The line crosses up through the purple trigger while between +50 and +150: the push is starting again.
- Pullback long (PB)In an uptrend, the line turns up through the trigger at or below −50: a dip that is ending.
- Respect the stretchAbove +150 the line turns yellow: stretched and prone to snap back. A yellow dot as it leaves is a time to think about profit.
Reading a signal
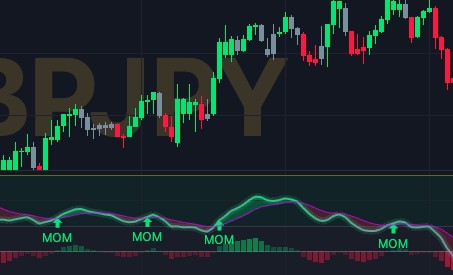
MOM signals on GBPJPY 1H, 19–21 Oct. Each green MOM arrow marks a momentum long in the pane. The green candles above show the same push in price.
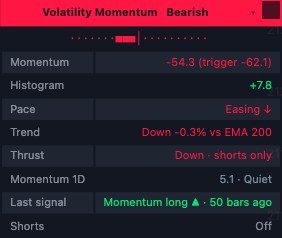
The info panel
- Header and meter: Bullish, Quiet, Bearish or Stretched, with ■ blocks showing how strong.
- Pace: Building ↑ or Easing ↓, from the histogram.
- Trend: Up or Down, and how far price is from the 200 EMA in %.
- Thrust: Up · longs only, Down · shorts only, or Flat · either way.
- Momentum 1D: the same reading on the daily chart. Last signal: what fired and how many bars ago.
Golden rules
- It is a tool, not a signal service. Signals only confirm when the candle closes.
- Shorts are off for a reason: the settings say short-side signals tend to be less reliable.
- Never skip the stop loss. Risk 1% of your account or less per trade.
- Practise first with the Replay button: play old candles forward and trade the arrows for free.
🔔 Get told when it fires: click Alerts (the bell), choose Volatility Momentum and tick “Momentum long” and “Pullback long”.
For educational purposes only. The results in this guide come from testing on past prices. Past performance does not guarantee future results, and real spreads, slippage and delays can make results worse. Nothing here is financial advice, and trading carries a high risk of losing money. Read the risk warning.