



INDICATOR · BEGINNER GUIDE
VOLUME PROFILE
A sideways bar chart of where today’s trading happened, with the busiest price and the value area marked in plain English.
◆Covers today’s session◆Busiest price (POC)◆70% value area◆Plain-English info panel
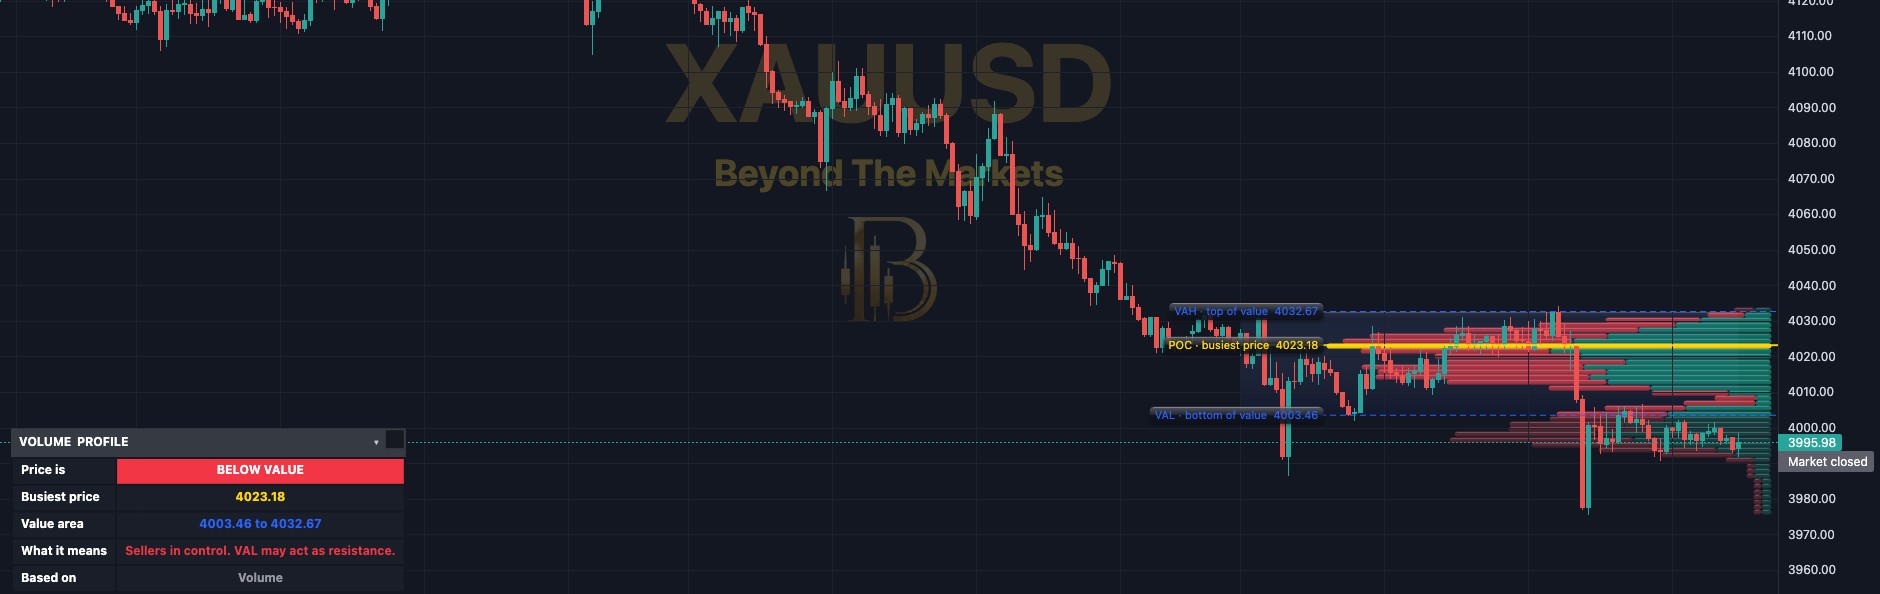 WHAT YOU SEE · GOLD 15m · TODAY’S PROFILE
123456
1Sideways bars: longer bar = more trading at that price. Green part = up candles, red part = down candles.
2Yellow POC: the busiest price of the day, where the most trading happened.
3VAH line: top of value: the upper edge of the area where most trading happened.
4VAL line: bottom of value: the lower edge of that area.
5Blue shading: the value area: the price range that holds 70% of the day’s trading.
6Info panel: says if price is above, inside or below value, and what that usually means.
Use it in 5 steps
- Switch it onOpen Charts → Basic Indicators → tick Volume Profile. It covers today’s session; on daily charts it uses the last 200 bars.
- Find the busiest priceThe yellow POC is where most trading happened today. Treat it as a key level: price often reacts around it.
- Inside value = rangingBetween VAL and VAH, price often moves from one edge to the other. Buying at the top edge is chasing.
- Outside value = controlAbove VAH: buyers in control, VAH may act as support. Below VAL: sellers in control, VAL may act as resistance.
- Use the levels to planUse POC, VAH and VAL to place stop losses and targets. They are levels to watch, not buy or sell signals.
The levels up close
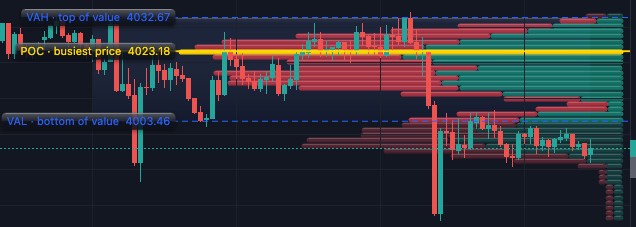
Gold 15m, 23 Oct. Most trading happened around the yellow POC. A late drop took price below the VAL, so the panel reads BELOW VALUE.
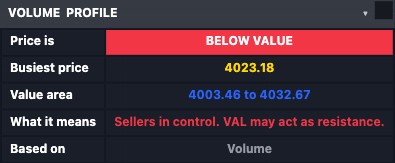
The info panel
- Price is: ABOVE VALUE, INSIDE VALUE or BELOW VALUE, in a coloured box.
- Busiest price: the POC. Value area: the VAL to VAH range.
- What it means: e.g. “Ranging. Price often moves between VAL and VAH.”
- Based on: Volume, or Time at price when a market has no volume.
- Click the title bar to hide it. Drag it by its grip to move it.
Golden rules
- Levels, not signals. Wait for price to react at POC, VAH or VAL before acting.
- Early in the day it is thin. A profile from a few candles means little. Let the session build.
- Never skip the stop loss. Risk 1% of your account or less per trade.
- Practise first with the Replay button: play old candles forward and watch price use the levels.
🔔 Get told when it fires: click Alerts (the bell), choose Volume Profile and tick “Broke above the value area (VAH)” and “Broke below the value area (VAL)”.
For educational purposes only. The results in this guide come from testing on past prices. Past performance does not guarantee future results, and real spreads, slippage and delays can make results worse. Nothing here is financial advice, and trading carries a high risk of losing money. Read the risk warning.