



INDICATOR · BEGINNER GUIDE
VOLUME
How busy each candle was, an average line for normal, and relative volume: is this candle quiet, normal or a spike? Busy candles show where the big moves and the big players are.
◆Bars coloured by the candle◆Bright bars = spikes◆Relative volume mode◆Spike alert
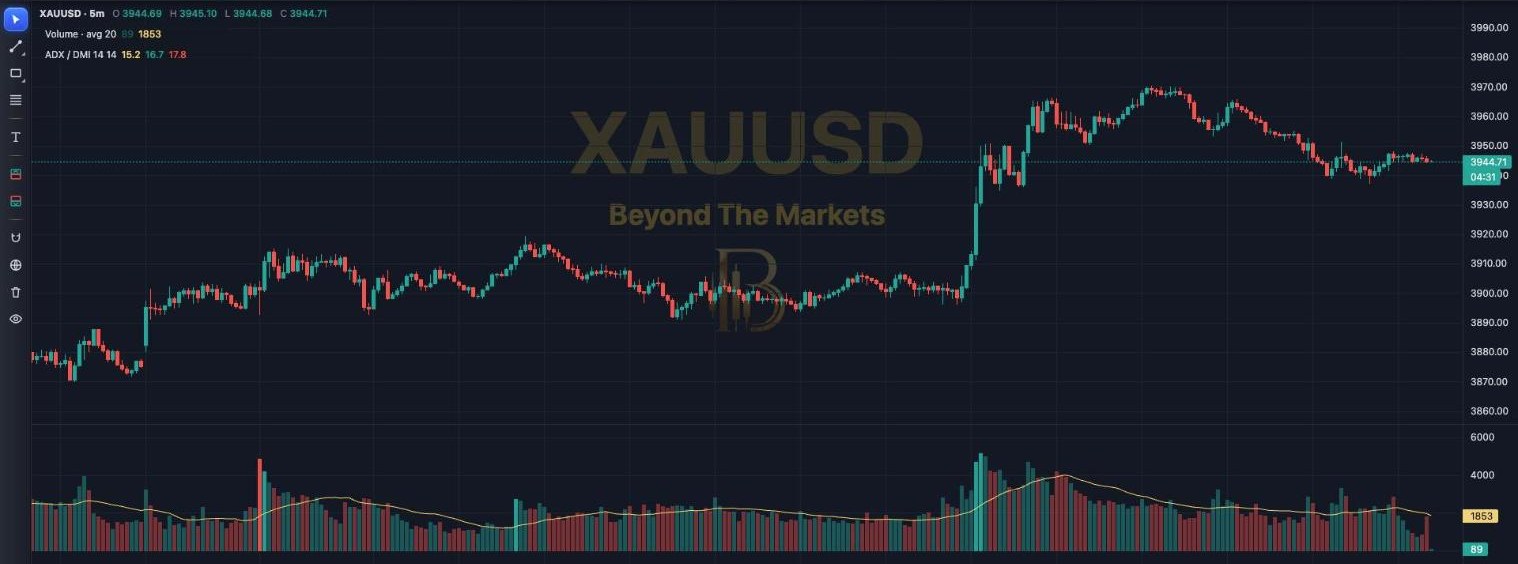 WHAT YOU SEE · XAUUSD 5m · SPIKES AT THE NEW YORK OPEN
12345
1Legend: this candle’s volume and the average.
2Bright bar: a spike, at least 2× the average. Green = rising candle, red = falling.
3Gold line: the 20-candle average, what “normal” looks like right now.
4Faded bars: ordinary candles. A run of short bars = a quiet market.
5Right edge: the live candle’s volume so far and the average.
Use it in 5 steps
- Add itBasic Indicators → tick Volume (with Relative Volume). It opens in its own panel under the chart.
- Find normalBars around the gold line are normal. Well above = busy, well below = quiet.
- Spot the spikesBright bars are 2× normal or more: news, a session open or a breakout.
- Check the moveA breakout on a spike has real backing. A breakout on quiet volume fails more often.
- Get the alert🔔 Alerts → Volume spike, so you hear when a market suddenly wakes up.
What is relative volume?
- This candle’s volume divided by its average: 1.0 = normal, 2.0 = twice as busy.
- It works the same on every market, so a spike on EURUSD and on gold mean the same thing.
- ⚙ → Show: Relative volume swaps the bars for it, with lines at 1 (normal) and your spike level.
- On forex, metals and indices this is tick volume from MT5: how many times the price changed.
Tick volume isn’t the number of contracts traded (forex has no central exchange), but it rises and falls with real activity, which is what you need for spotting busy and quiet spells.
Good to know
- Volume is usually lowest in Asia and highest at the London and New York opens.
- A huge spike against a long move can mean exhaustion: the last buyers or sellers piling in.
- The live candle starts at zero and grows, so judge it when it closes.
Good questions for ✨ Explain
- “Is volume backing this move?”
- “When was the last volume spike, and what did price do?”
- “Is this market quiet or busy right now?”
Golden rules
- Volume confirms, it doesn’t predict.
- Never trade on volume alone.
- Risk 1% or less per trade.
Tip: pair it with BTM – Killzone: watch how volume jumps when each session opens.
For educational purposes only. The results in this guide come from testing on past prices. Past performance does not guarantee future results, and real spreads, slippage and delays can make results worse. Nothing here is financial advice, and trading carries a high risk of losing money. Read the risk warning.