



INDICATOR · BEGINNER GUIDE
VWAP
The average price paid today, weighted by volume. It restarts every trading day at 17:00 New York, with a band either side.
◆Restarts 17:00 New York◆Weighted by volume◆One band either side◆Hidden on daily charts
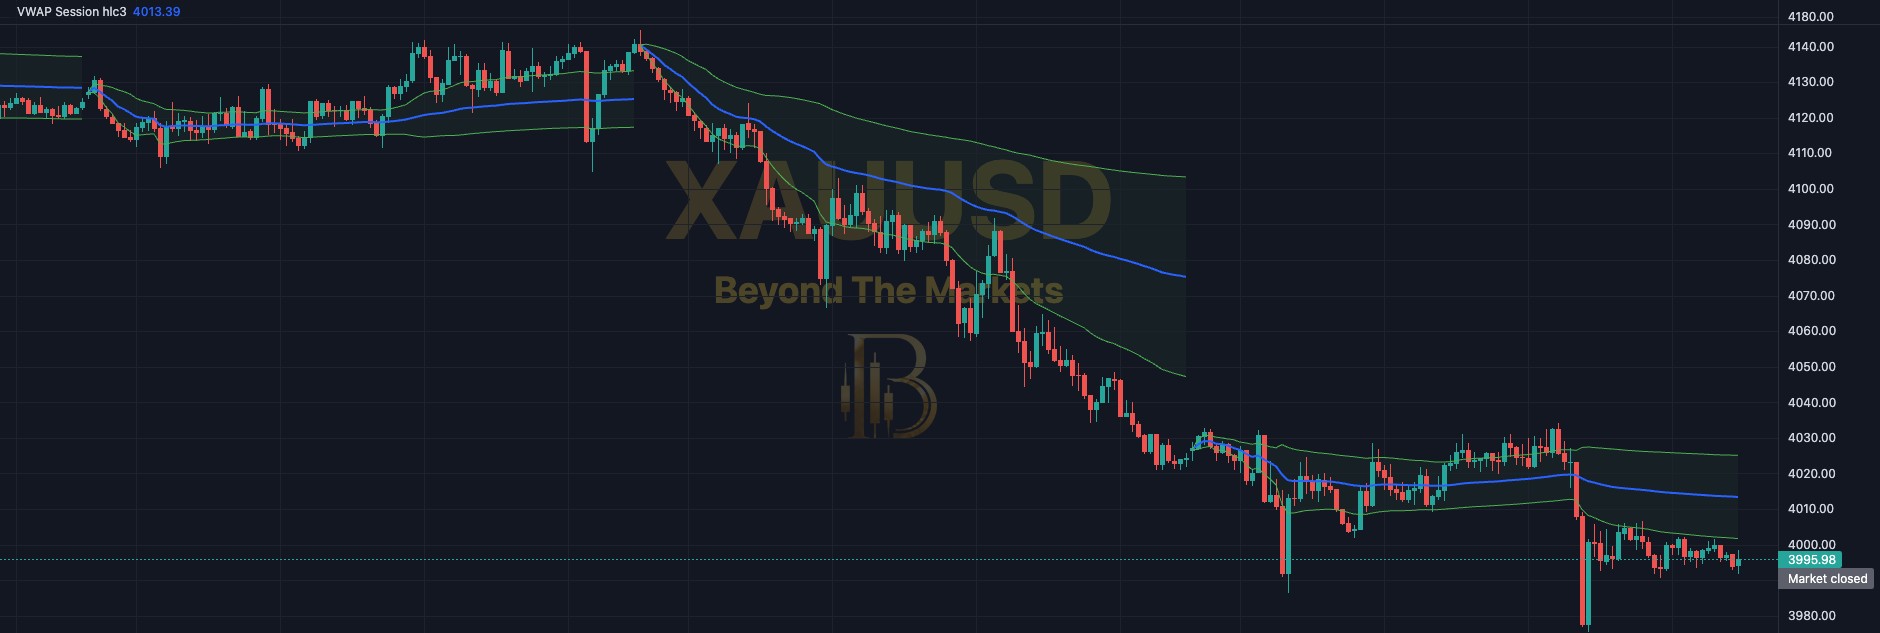 WHAT YOU SEE · GOLD 15m · SESSION VWAP
123456
1Blue line (VWAP): the average price since today’s session began, with busier candles counting more.
2Upper green band: 1 standard deviation (the usual spread) above VWAP. Price is stretched high.
3Lower green band: 1 standard deviation below VWAP. Price is stretched low.
4Faint green shading: fills the space between the bands: today’s normal zone.
5Gap and restart: at 17:00 New York all lines break and start again from the new day’s first candle.
6Price above or below: above VWAP = buyers paying more than today’s average. Below = sellers in charge.
Use it in 5 steps
- Switch it onOpen Charts → Basic Indicators (ƒx) → tick VWAP. Use an intraday chart: it is hidden on daily charts and higher by default.
- Note which side price isPrice holding above the blue line: buyers in control today. Holding below: sellers. Use it as today’s trend filter.
- Go easy early in the dayThe line starts fresh each day, so the first candles move it a lot. It settles as the day goes on.
- Use the bandsPrice at the upper band is stretched up; at the lower band, stretched down. Chasing a trade out there is risky.
- Stop beyond, not on itWhen trading a bounce off VWAP, place the stop loss past the recent swing on the other side, never right on the line.
Reading a session
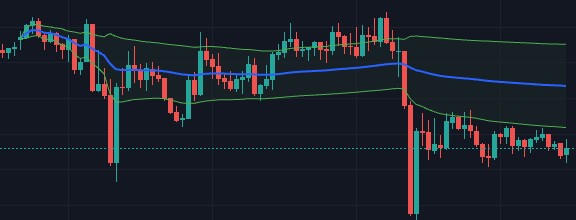
Gold 15m, 23 Oct session. The VWAP restarted at 17:00 New York with the bands pinched. Price worked around the blue line, then a big drop sent it below the lower band, where it stayed.
⚙ VWAP
VWAP
Anchor periodSession (New York 17:00)
Sourcehlc3
Hide VWAP on 1D or above✓ On
Bands
Bands calculation modeStandard deviation
Band #1✓ On
Band #1 multiplier1
Band #2Off
Band #3Off
Fill between the bands✓ On
Settings worth knowing
- Anchor period: when it restarts. Session (New York 17:00) by default; also London or UTC midnight, Week or Month.
- Band #2 and #3 (off): extra bands at 2 and 3 standard deviations, for bigger stretches.
- Bands calculation mode: Standard deviation, or a fixed Percentage of the VWAP.
- Hide VWAP on 1D or above (ticked). Untick it to see a Week or Month VWAP on a daily chart.
- Source hlc3 = (high + low + close) ÷ 3, each candle’s typical price.
Golden rules
- It is a today tool. It restarts every session, so it says nothing about the long-term trend.
- Don’t chase stretched price. Far outside the bands, wait for price to come back.
- Never skip the stop loss. Risk 1% of your account or less per trade.
- Practise first with the Replay button: play old candles forward and trade them for free.
🔔 Get told when it fires: click Alerts, choose VWAP and tick “Price crosses above VWAP” or “Price crosses below VWAP”.
For educational purposes only. The results in this guide come from testing on past prices. Past performance does not guarantee future results, and real spreads, slippage and delays can make results worse. Nothing here is financial advice, and trading carries a high risk of losing money. Read the risk warning.